Release date: May 25, 2016 | Next release date: June 2, 2016
Oil companies focus on production over exploration as low oil prices reduce value of new reserves
For the second consecutive year, oil companies worldwide produced more oil and natural gas than they added to their proved reserves, excluding revisions to existing proved reserves and purchases of reserves in place. This is not necessarily an indication of fewer available resources, but rather that at current prices, there are fewer resources that can be turned into proved reserves, which are underground oil and gas that can be commercially produced at current prices using currently available technology.
Based on analysis of recently released annual reports, 85 publicly traded companies added a total of 13.7 billion barrels of oil equivalent (BOE) to their reserves base, three-quarters of the amount the same group of companies produced in 2015. A combination of reductions in exploration and development (E&D) investment and fewer extensions and discoveries contributed to the decline. Of the companies that submitted first-quarter 2016 financial results, capital expenditures declined 35% from first-quarter 2015, suggesting continued reductions in E&D investment, which could reduce reserves additions in 2016.
The reserves replacement ratio—the ratio of proved reserves added during a given year to production for that year—indicates the extent to which a company is replacing its produced reserves (Figure 1). The group of 85 companies as a whole had a reserves replacement ratio of approximately 100% in 2012 and 2013, and around 75% for 2014 and 2015. However, the ratios vary significantly by company type. Only the U.S. onshore companies added more reserves to their collective portfolio than they produced in 2015, but the effect on the global reserves base is modest because these companies hold a relatively small share of proved reserves and production.
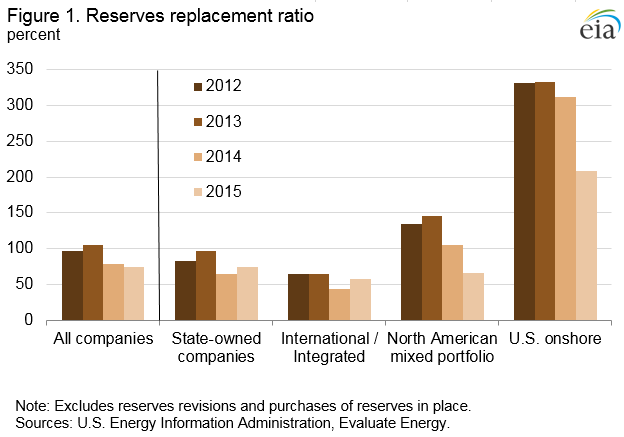
Each company grouping differs by its area of operations and the types of assets in its portfolio. State-owned companies are mostly national oil companies outside of the Organization of the Petroleum Exporting Countries (OPEC). The international/integrated oil companies are large producers that have refining and midstream assets, with global portfolios of onshore and offshore oil production. The North American mixed companies are U.S. and Canadian exploration and production (E&P) companies that are smaller producers but with fairly broad portfolios geographically and by production type, including shale, oil sands, and offshore. The U.S. onshore producers are smaller E&P companies that focus mainly on onshore production in the United States. Collectively, the 85 companies produced 50 million BOE per day in 2015, two-thirds of which was crude oil and the remainder being natural gas and hydrocarbon gas liquids.
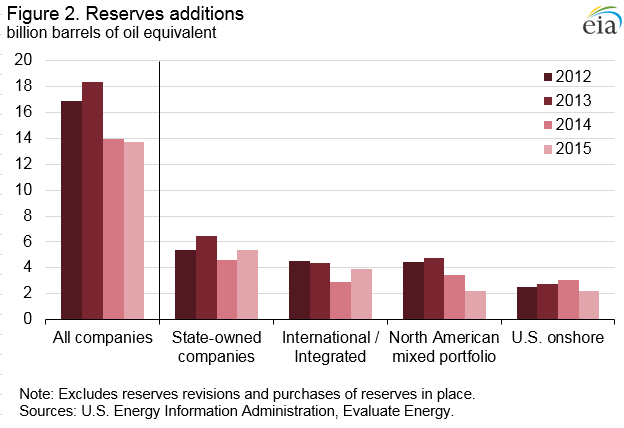
Analysis by major area of operations and production portfolio also reveals volumetric differences in reserves additions (Figure 2). State-owned companies and international/integrated oil companies increased reserves additions in 2015, while North American companies with a mixed production portfolio and U.S. onshore companies added less than in 2014. Companies can add proved reserves through new discoveries, enlargement of a reservoir’s proved area (extensions), improvements in the recovery of existing reserves, purchases of another company’s proved reserves, or revisions of existing reserves for economic or technical reasons. For the purposes of this analysis, purchases of reserves in place and reserves revisions are excluded from the calculation of reserves additions.
Expenditures for E&D constitute most of a company’s upstream capital investment. When calculated on a reserve addition per barrel basis, these expenditures represent the cost of finding and developing a barrel of oil. Finding and developing costs declined $10.23/BOE in 2015 (Figure 3). Since there may be a timing mismatch between when an expenditure is made and when a proved reserve addition is formally recognized, standard practice is to average the results over several years. Finding and developing costs for these companies were $25.69/BOE in 2015, the lowest in the 2012-15 period and lower than the four-year average of $29.25/BOE.
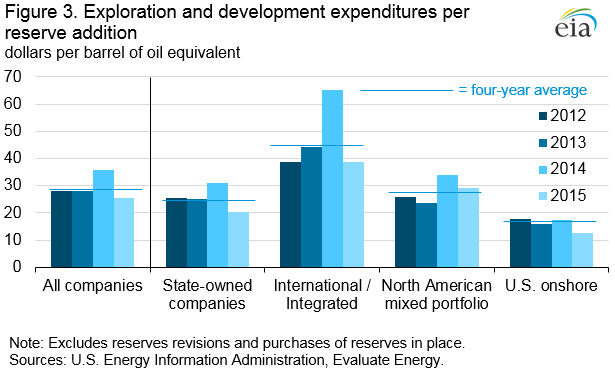
Similar to the reserves additions and the reserves replacement ratio, finding and developing costs differed across the company groupings. In recent years, U.S. onshore companies tended to have lower E&D expenditures per reserve addition compared with the other groups, as many reserves additions came from geologically familiar shale basins in the United States. Other producers typically operate in areas where it is more challenging to find reserves, such as deepwater offshore or in more mature fields that are the foundation of legacy production (such as in China or Russia). The decline in E&D expenditures for national oil companies and international/integrated companies suggests a reduction in exploration activity in such high-cost areas.
With most companies indicating continued reductions in E&D budgets absent a meaningful increase in crude oil prices, proved reserves additions will likely continue to decline.
U.S. average regular gasoline retail and diesel fuel prices increase
The U.S. average regular gasoline retail price increased six cents from the previous week to $2.30 per gallon on May 23, down 47 cents from the same time last year. The Midwest price increased 10 cents to $2.28 per gallon, followed by the Gulf Coast, up eight cents to $2.06 per gallon. The Rocky Mountain price rose six cents to $2.30 per gallon, the East Coast price increased three cents to $2.25 per gallon, and the West Coast price rose one cent to $2.66 per gallon.
The U.S. average diesel fuel price increased six cents from a week ago to $2.36 per gallon, down 56 cents from the same time last year. The Gulf Coast price rose eight cents to $2.23 per gallon, followed by the West Coast price, which increased seven cents to $2.60 per gallon. The East Coast price increased six cents to $2.38 per gallon, the Midwest price rose five cents to $2.33 per gallon, and the Rocky Mountain price was up three cents to $2.36 per gallon.
Propane inventories fall slightly
U.S. propane stocks decreased by 0.1 million barrels last week to 74.1 million barrels as of May 20, 2016, 0.9 million barrels (1.2%) higher than a year ago. East Coast and Gulf Coast inventories decreased by 0.2 million barrels and 0.1 million barrels, respectively. Midwest inventories increased by 0.2 million barrels, while Rocky Mountain/West Coast inventories remained unchanged. Propylene non-fuel-use inventories represented 5.4% of total propane inventories.
For questions about This Week in Petroleum, contact the Petroleum Markets Team at 202-586-4522.
Retail prices (dollars per gallon)
| Gasoline | 2.300 | 0.058 | -0.474 |
| Diesel | 2.357 | 0.060 | -0.557 |
Futures prices (dollars per gallon*)
| Crude oil | 47.75 | 1.54 | -11.97 |
| Gasoline | 1.636 | 0.048 | -0.418 |
| Heating oil | 1.490 | 0.087 | -0.463 |
| *Note: Crude oil price in dollars per barrel. | |||
Stocks (million barrels)
| Crude oil | 537.1 | -4.2 | 57.7 |
| Gasoline | 240.1 | 2.0 | 19.5 |
| Distillate | 150.9 | -1.3 | 22.0 |
| Propane | 74.129 | -0.087 | 0.911 |