Release date: June 15, 2016 | Next release date: June 22, 2016
Higher U.S. gasoline production and inventories are reducing gasoline crack spreads
U.S. refiners are shifting their output mix to increase the gasoline production share and reduce the distillate production share, which is increasing gasoline inventories and beginning to reduce the gasoline crack spread—the difference between gasoline futures prices and crude oil. Monthly average gasoline crack spreads are now lower than they were last year, the second consecutive month of year-over-year declines. While distillate crack spreads are also lower than last year, they are only 3 cents per gallon (gal) lower than the five-year average and have increased 9 cents/gal over the past two months. Changing gasoline-to-distillate production ratios are a contributing factor in the difference in crack spreads.
The U.S. gasoline-to-distillate production ratio began increasing in 2015, reversing a several-year decline. In May 2016, the gasoline-to-distillate production ratio reached a five-year high of 2.12 (Figure 1). Over time, refineries have some ability to adjust petroleum product yields in response to changes in price signals by adding additional equipment or modifying processes and feedstocks. A way for refineries to gauge product value is to look at the prices of futures contracts for delivery of a product at a future date. Because both gasoline and distillate prices exhibit seasonality in the summer and winter months, averaging the front-month and sixth-month futures contract price of each of the gasoline and distillate contracts and then calculating the price spread between the two averages provides insight into the price spread between these two physical products without reflecting sudden seasonal price swings that occur throughout the year.
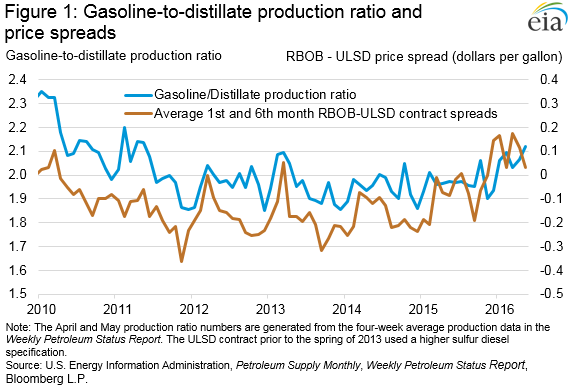
From 2010 to 2013, U.S. refineries increased production of distillate compared with gasoline because the average price of the New York Harbor distillate contract, which began trading ultra-low sulfur diesel (ULSD) in the spring of 2013, rose compared with the reformulated blendstock for oxygenate blending (RBOB, the petroleum component of gasoline) contract over that period. The strength in distillate prices was in response to rising distillate demand in developing countries, while U.S. demand for gasoline was stagnant or declining during much of that time.
However, in 2015, the trend changed, as the price of RBOB futures contracts rose compared with distillate contracts because of lower distillate demand and higher distillate inventories globally. Lower economic growth in developing countries and increased distillate exports from the Middle East and China led to high distillate stock levels in major storage hubs, including Singapore, northwest Europe, and the United States. On the other hand, the drop in crude oil prices in late 2014 was one of many factors that led to an increase in gasoline demand, both domestically and abroad. These developments spurred U.S. refineries to increase gasoline yields, which is contributing to the rise in overall U.S. gasoline production. In first-quarter 2016, total U.S. refinery and blender net production rose 0.82%, compared with the same period in 2015. During the same span, gasoline production rose 2.18%, while distillate production declined 2.56%.
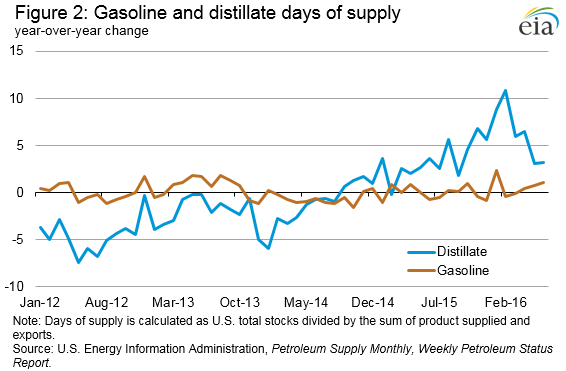
Inventories of both gasoline and distillate have been above the five-year historical range for most of 2016. As refineries increased gasoline production to meet rising demand, U.S. gasoline inventories leveled off after months of declines but are still well above the five-year range. On an absolute basis, gasoline inventories are 19 million barrels greater than at the same time last year and distillate inventories are also 19 million barrels higher. On days-of-supply basis, taking into account both domestic consumption and exports, U.S. gasoline inventories can fulfill an additional day of total gasoline demand than the same period last year (Figure 2). The year-over-year change in days of supply for gasoline gradually increased since February. Alternatively, the decline in distillate production and a slight strengthening of distillate demand following a very warm winter in the Northeast reduced the year-over-year change in distillate days of supply from a high of nearly 11 days in February to 3.2 days, according to the latest Weekly Petroleum Status Report.
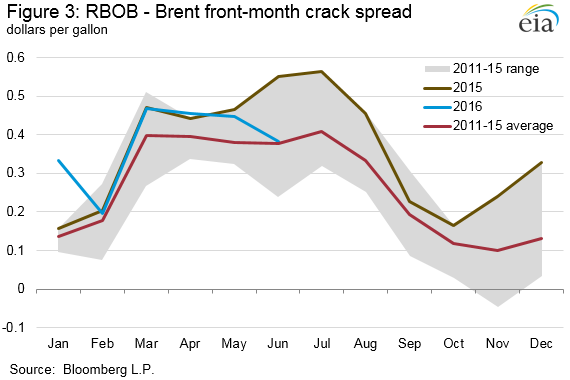
Despite an increase in gasoline consumption and exports so far this year over the comparable 2015 period, higher inventory levels are likely moderating price increases typically seen during the start of the summer driving season. Through June 14, the June 2016 average RBOB-Brent front month futures crack spread so far is 38 cents/gal compared with the June 2015 monthly average of 55 cents/gal last June (Figure 3). Unlike last spring and summer, when refineries were seeing gasoline crack spreads at their highest level since 2007, this year gasoline crack spreads may retreat closer to the average seen over the past five years.
U.S. average regular gasoline retail and diesel fuel prices increase
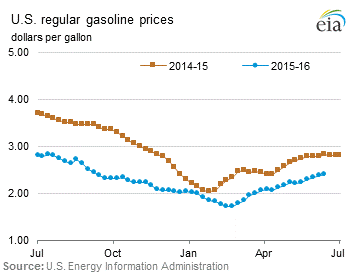
The U.S. average regular gasoline retail price rose two cents from the previous week to $2.40 per gallon on June 13, down 44 cents from the same time last year. The East Coast and Gulf Coast prices both decreased one cent to $2.31 per gallon and $2.14 per gallon, respectively. The Midwest price rose six cents to $2.47 per gallon. The West Coast price increased two cents to $2.72 per gallon. The Rocky Mountain price rose one cent to $2.32 per gallon.
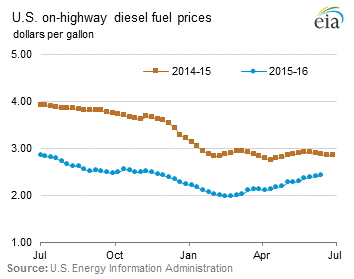
The U.S. average diesel fuel price increased two cents to $2.43 per gallon, down 44 cents from the same time last year. The Midwest, Gulf Coast, and West Coast prices each increased three cents to $2.39 per gallon, $2.31 per gallon, and $2.71 per gallon, respectively. The Rocky Mountain price increased two cents to $2.41 per gallon. The East Coast price rose one cent to $2.45 per gallon.
Propane inventories gain
U.S. propane stocks increased by 1.1 million barrels last week to 78.4 million barrels as of June 10, 2016, 2.3 million barrels (2.9%) lower than a year ago. Midwest, Gulf Coast and Rocky Mountain/West Coast inventories increased by 0.7 million barrels, 0.6 million barrels, and 0.2 million barrels, respectively. East Coast inventories decreased by 0.4 million barrels. Propylene non-fuel-use inventories represented 4.3% of total propane inventories.
For questions about This Week in Petroleum, contact the Petroleum Markets Team at 202-586-4522.
Retail prices (dollars per gallon)
| Gasoline | 2.399 | 0.018 | -0.436 |
| Diesel | 2.431 | 0.024 | -0.439 |
Futures prices (dollars per gallon*)
| Crude oil | 49.07 | 0.45 | -10.89 |
| Gasoline | 1.560 | -0.048 | -0.561 |
| Heating oil | 1.516 | 0.028 | -0.373 |
| *Note: Crude oil price in dollars per barrel. | |||
Stocks (million barrels)
| Crude oil | 531.5 | -0.9 | 63.6 |
| Gasoline | 237.0 | -2.6 | 19.2 |
| Distillate | 152.2 | 0.8 | 18.6 |
| Propane | 78.351 | 1.057 | -2.309 |
