HAIC, Education, Scholarship & Philanthropy Committee Co-Chairs Presenting

HAIC, Education, Scholarship & Philanthropy Committee Co-Chairs Presenting


HAIC, Education, Scholarship & Philanthropy Committee Co-Chairs presenting ITEP Executive Director, Amy Grat, with a $1,500 check to help fund the ITEP’s Global Environmental Science Academy (GESA), Catalina Environmental Leadership Program (CELP). Some 70 students and chaperones in the GESA program visit Catalina for a few days to study the plant and animal life of the kelp ecosystem, and learn about its connections to the terrestrial ecosystems, and the important role that the ocean plays in the biosphere. Focus is centered on each student’s role within these systems and the impact of human beings on our environment. Emphasis is placed on the responsible use of limited resources and the development of goals for future sustainable living. During this program the fundamental principles of life are taught, which apply to both nature and humanity while infusing opportunities for social emotional, and academic growth.

The Financial Assault, Part 2: RAN is at it again

The activists at the Rainforest Action Network have ramped up their campaign against the banks financing the Dakota Access pipeline. Last month, RAN called on Citigroup to “halt all further loan disbursements for the Dakota Access pipeline and ensure that the project sponsors immediately halt construction, unless all outstanding issues are resolved to the full satisfaction of the Standing Rock Sioux Tribe.”

RAN cited Citigroup’s involvement with the Equator Principles—a set of rules adopted by financial institutions “for determining, assessing and managing environmental and social risk in project finance”—as they reason they should stop funding DAPL.

When that didn’t get the desired response, RAN and 500 other activist groups—including 350.org, Greenpeace and the Sierra Club—sent an open letter last week to the CEOs of 17 banks that are financing DAPL, demanding an “immediate halt to financing the DAPL.” And once again, they cited the Equator Principles as justification for their actions.

“The undersigned organizations,” they wrote, “are closely watching how the banks providing financial support to the project are acting on the ever worsening situation on the ground, including your bank.” (Emphasis added.)

This recent action is one part of a coordinated, multifaceted effort to pressure financial services companies—including insurance providers, institutional investors and their advisors—into defunding or divesting from oil and natural gas projects. Following the results of the presidential election, environmental activists have shifted their focus away from federal regulatory and legislative battles toward more unconventional fights on the state and local levels, as well as online. Unfortunately, it looks like this campaign against the banks financing DAPL is a harbinger of things to come.


READ

Hydraulic fracturing has no “widespread, systemic” impact on US drinking water

An Important Statement by Gov. Brown regarding Goods Movement

Wednesday, July 22nd, 2015
Original Article Here

On Friday, Governor Brown issued Executive Order B-32-15 requiring a balanced, integrated plan to improve the economic competitiveness and the environmental performance of California’s goods movement sector.  This was a welcomed and important statement by the Administration regarding a critical part of the California economy.

Goods movement has long been one of California’s largest and most important economic sectors.   Taken collectively, its components – shipping, port operations, rail, trucking, warehousing, etc. – represent roughly one third of the economic activity and one third of all jobs in California’s massive economy.  By far, more goods flow through California’s ports than any other state in the nation.  Indeed, the United States’ overall trade economy relies upon on California’s success in goods movement.

However, in an ever competitive global supply chain, California is under intensifying pressure to maintain and grow market share.  The massive project widening the Panama Canal will be completed soon enabling goods to bypass California altogether to serve eastern U.S. markets.   This, coupled with additional competition from improved port operations in Canada and Mexico, along with eastern U.S. states eager to poach our business, should give all Californians pause as we consider the long term implications to that one third of our economy mentioned above.

And if that weren’t complicated enough, California’s goods movement sector must operate within the nation’s strictest emissions regulations.  Accordingly, industry has responded to state mandates by modernizing operations in order to meet and exceed emissions targets.  A great example is the technological marvel that is the new Middle Harbor at the Port of Long Beach that will both boost productivity and reduce emissions through automation and low carbon operations.  It represents the kind of major investment and commitment that industry is prepared to make when it is confident that the state is a willing partner.

This is why the Governor’s executive order matters so much.  It sets forth a clear policy that we must achieve a proper balance between economic, environment and infrastructure needs.  It reinforces the critical principle that the term sustainability must mean both environmentally and economically sustainable.

Indeed that policy has been evident thus far in the California Air Resources Board’s approach to the development of a new Sustainable Freight Plan that seeks to move the entire goods movement sector to zero or near zero emissions.   A transformation of that scale can only happen through thoughtful, public and private collaboration and investment.

So as the Administration and Legislature now consider our future transportation funding and priorities, and as they determine how best to reinvest the proceeds of the AB 32 Cap and Trade program, they would do well to advance the policy outlined in the Governor’s Executive Order, and commit to creating the conditions in which California’s preeminence in goods movement can endure for generations to come.

Paramount 21st Century Threat Meets Critical Workforce Demand

$15.4 million – Average cost to a company from a cybercrime

100 million – Number of Cyberattacks directed at Los Angeles City government departments

209,000 – Cybersecurity jobs in the U.S. that are unfilled

FF Cyber Security

On December 14th, the LAEDC will host its seminal series, Future Forum, where Cyber Security will be the issue in focus. In the last five years we have seen a serious uptick in cyber attacks – in all its manifestations – across wide swaths of key industry clusters, from entertainment, defensegovernment, retail, transportation, and financial and insurance services. Even politics is not off limits to cyber attacks as demonstrated by the Presidential election when news broke that the Democratic National Committee was infiltrated by malware planted by two Russian hacking crews. The impact and consequences of a cyber attack have never been more concerning. For Los Angeles, a region that encompasses many leading industries, universities, businesses, and vital access points for national and international trade, securing these assets and infrastructure has never been more paramount.

But what methodologies and best practices exist to counter the cyber threat? How do public and private sector organizations prepare their workforce for an ever-evolving threat? What is the current state of job growth and employment demand for IT and cyber security professionals?

Research and data from the Bureau of Labor Statistics to well-respected global information security and management firms such as CISCO and Kaspersky Lab, indicate significant job growth and in-demand positions by both public and private sector employers for this burgeoning field of information technology. The federal government, in its Cybersecurity National Action Plan, budgeted more than $62 million for cyber security personnel and recruitment of the next generation cybersecurity workforce through the following incentives:

  • National Initiative for Cybersecurity Education
  • Expansion of the Scholarship for Service program
  • Establishing a CyberCorps Reserve
  • Development of a Cybersecurity Core Curriculum
  • Increasing and bolstering investment in, participating universities in the National Centers for Academic Excellence in Cybersecurity Program
  • Enhancing student loan forgiveness programs for cybersecurity experts joining the Federal workforce

As a region, Southern California is well-positioned to heed the call by federal government employers as our region is home to many leading colleges and universities including four which are accredited as National Centers for Academic Excellence by the Department of Homeland Security and the National Security Agency: Cal Poly Pomona, CSU San Bernardino, CSU Dominguez Hills, and UC Irvine. 

Future Forum on Cyber Security, while serious in topic, presents the ideal opportunity to gather key stakeholders, students, and public and private sector professionals from throughout LA County to come together to discuss how best we can combat the cyber threat and be at the cusp of innovative cybersecurity tactics and best practices. 

SCAG Summit includes LAEDC Economic Update for L.A. County

scag-econ-update-coverAn economic update for L.A. County has been published, including updates on growing industries and occupations, providing an objective look at the jobs created since the Great Recession.  The report identifies the importance of fostering job growth in our region’s export-oriented industries where we have regional competitive advantage, such as aerospace, entertainment and digital media, bioscience, advanced teransportation and others.  The report also notes our current trajectory, which includes a high percentage of job growth in low-paying occupations, which is a stark reminder of the importance of focused economic development to create better paying jobs that are critical to raising standards of living for L.A .County.

The report is part of a group of reports published by Southern California Association of Governments (SCAG), and SCAG generously commissioned the report as part of it’s Seventh Annual Southern California Economic Summit, which took place on Dec 1st, 2016.

Read the Report HERE. 

Read media coverage HERE.

Higher U.S. gasoline production and inventories are reducing gasoline crack spreads (6/15/2016)

Release date: June 15, 2016  |  Next release date: June 22, 2016

Higher U.S. gasoline production and inventories are reducing gasoline crack spreads

U.S. refiners are shifting their output mix to increase the gasoline production share and reduce the distillate production share, which is increasing gasoline inventories and beginning to reduce the gasoline crack spread—the difference between gasoline futures prices and crude oil. Monthly average gasoline crack spreads are now lower than they were last year, the second consecutive month of year-over-year declines. While distillate crack spreads are also lower than last year, they are only 3 cents per gallon (gal) lower than the five-year average and have increased 9 cents/gal over the past two months. Changing gasoline-to-distillate production ratios are a contributing factor in the difference in crack spreads.

The U.S. gasoline-to-distillate production ratio began increasing in 2015, reversing a several-year decline. In May 2016, the gasoline-to-distillate production ratio reached a five-year high of 2.12 (Figure 1). Over time, refineries have some ability to adjust petroleum product yields in response to changes in price signals by adding additional equipment or modifying processes and feedstocks. A way for refineries to gauge product value is to look at the prices of futures contracts for delivery of a product at a future date. Because both gasoline and distillate prices exhibit seasonality in the summer and winter months, averaging the front-month and sixth-month futures contract price of each of the gasoline and distillate contracts and then calculating the price spread between the two averages provides insight into the price spread between these two physical products without reflecting sudden seasonal price swings that occur throughout the year.

From 2010 to 2013, U.S. refineries increased production of distillate compared with gasoline because the average price of the New York Harbor distillate contract, which began trading ultra-low sulfur diesel (ULSD) in the spring of 2013, rose compared with the reformulated blendstock for oxygenate blending (RBOB, the petroleum component of gasoline) contract over that period. The strength in distillate prices was in response to rising distillate demand in developing countries, while U.S. demand for gasoline was stagnant or declining during much of that time.

However, in 2015, the trend changed, as the price of RBOB futures contracts rose compared with distillate contracts because of lower distillate demand and higher distillate inventories globally. Lower economic growth in developing countries and increased distillate exports from the Middle East and China led to high distillate stock levels in major storage hubs, including Singapore, northwest Europe, and the United States. On the other hand, the drop in crude oil prices in late 2014 was one of many factors that led to an increase in gasoline demand, both domestically and abroad. These developments spurred U.S. refineries to increase gasoline yields, which is contributing to the rise in overall U.S. gasoline production. In first-quarter 2016, total U.S. refinery and blender net production rose 0.82%, compared with the same period in 2015. During the same span, gasoline production rose 2.18%, while distillate production declined 2.56%.

Inventories of both gasoline and distillate have been above the five-year historical range for most of 2016. As refineries increased gasoline production to meet rising demand, U.S. gasoline inventories leveled off after months of declines but are still well above the five-year range. On an absolute basis, gasoline inventories are 19 million barrels greater than at the same time last year and distillate inventories are also 19 million barrels higher. On days-of-supply basis, taking into account both domestic consumption and exports, U.S. gasoline inventories can fulfill an additional day of total gasoline demand than the same period last year (Figure 2). The year-over-year change in days of supply for gasoline gradually increased since February. Alternatively, the decline in distillate production and a slight strengthening of distillate demand following a very warm winter in the Northeast reduced the year-over-year change in distillate days of supply from a high of nearly 11 days in February to 3.2 days, according to the latest Weekly Petroleum Status Report.

Despite an increase in gasoline consumption and exports so far this year over the comparable 2015 period, higher inventory levels are likely moderating price increases typically seen during the start of the summer driving season. Through June 14, the June 2016 average RBOB-Brent front month futures crack spread so far is 38 cents/gal compared with the June 2015 monthly average of 55 cents/gal last June (Figure 3). Unlike last spring and summer, when refineries were seeing gasoline crack spreads at their highest level since 2007, this year gasoline crack spreads may retreat closer to the average seen over the past five years.

U.S. average regular gasoline retail and diesel fuel prices increase

The U.S. average regular gasoline retail price rose two cents from the previous week to $2.40 per gallon on June 13, down 44 cents from the same time last year. The East Coast and Gulf Coast prices both decreased one cent to $2.31 per gallon and $2.14 per gallon, respectively. The Midwest price rose six cents to $2.47 per gallon. The West Coast price increased two cents to $2.72 per gallon. The Rocky Mountain price rose one cent to $2.32 per gallon.

The U.S. average diesel fuel price increased two cents to $2.43 per gallon, down 44 cents from the same time last year. The Midwest, Gulf Coast, and West Coast prices each increased three cents to $2.39 per gallon, $2.31 per gallon, and $2.71 per gallon, respectively. The Rocky Mountain price increased two cents to $2.41 per gallon. The East Coast price rose one cent to $2.45 per gallon.

Propane inventories gain

U.S. propane stocks increased by 1.1 million barrels last week to 78.4 million barrels as of June 10, 2016, 2.3 million barrels (2.9%) lower than a year ago. Midwest, Gulf Coast and Rocky Mountain/West Coast inventories increased by 0.7 million barrels, 0.6 million barrels, and 0.2 million barrels, respectively. East Coast inventories decreased by 0.4 million barrels. Propylene non-fuel-use inventories represented 4.3% of total propane inventories.

For questions about This Week in Petroleum, contact the Petroleum Markets Team at 202-586-4522.


Retail prices (dollars per gallon)

Conventional Regular Gasoline Prices Graph.On-Highway Diesel Fuel Prices Graph.
Gasoline 2.399 0.018 -0.436
Diesel 2.431 0.024 -0.439

Futures prices (dollars per gallon*)

Crude oil 49.07 0.45 -10.89
Gasoline 1.560 -0.048 -0.561
Heating oil 1.516 0.028 -0.373
*Note: Crude oil price in dollars per barrel.

Stocks (million barrels)

Crude oil 531.5 -0.9 63.6
Gasoline 237.0 -2.6 19.2
Distillate 152.2 0.8 18.6
Propane 78.351 1.057 -2.309

Storage capacity utilization rises, as growth in stored volumes outpaces expansion of storage capacity (6/8/2016)

Release date: June 8, 2016  |  Next release date: June 15, 2016

Storage capacity utilization rises, as growth in stored volumes outpaces expansion of storage capacity

The United States added 34 million barrels (6%) of working crude oil storage capacity from September 2015 to March 2016, the largest expansion of commercial crude oil storage capacity since EIA began tracking such data in 2011 (Figure 1). At the same time, reported weekly U.S. commercial crude inventories have increased by more than 72 million barrels (16%) since September, which implies crude oil storage capacity utilization at a record high of 74% for the week ending June 3.

Storage and capacity volumes used to calculate storage utilization rates must be comparable in scope to provide accurate estimates. Weekly U.S. crude inventories include volumes in transit by pipeline, tanker, barge and rail, and lease stocks. To facilitate accurate utilization calculations, EIA’s biannual Working and Net Available Shell Storage Capacity Report, which is released with March and September data, now provides information on the sum of working storage capacity, stocks in transit by pipeline, tanker, barge and rail, and lease stocks. This tally provides a capacity estimate with the same scope as commercial inventories reported by EIA for use as the denominator when calculating storage capacity utilization. Simply dividing total commercial inventories by working storage capacity alone would overstate utilization because it does not account for the volume of crude oil stored outside of tankage (pipeline fill and stocks in transit). Using weekly data, crude oil storage capacity utilization can be estimated by subtracting the amount of Alaskan crude oil in transit from commercial inventories, then dividing by the sum of working storage capacity, stocks in transit, and pipeline fill from the most recently available Working and Net Available Shell Storage Capacity Report.

The large increase in crude storage capacity between September and March was prompted by increased demand for crude oil storage as global supply has outpaced global demand for most of the past two years. Because of generally rising crude oil inventories since the end of 2014, the structure of crude oil futures prices has been in steep contango, where near-term deliveries are discounted versus long-term deliveries. The Nymex West Texas Intermediate (WTI) 1-13 spread averaged $7.25 per barrel between September and March. The large and continued contango structure prompted many market participants to place more crude oil into storage.

The largest commercial crude oil storage capacity expansions were in Petroleum Administration for Defense Districts (PADD) 2 (Midwest) and 3 (Gulf Coast), 19 million barrels (13%) and 13 million barrels (4%), respectively. Combined, PADDs 2 and 3 represent 82% of total U.S. commercial crude oil storage capacity. Within PADD 2, storage capacity at Cushing, Oklahoma, the delivery point for the Nymex WTI futures contract, expanded 1.5 million barrels (2%), similar to the previous period of March 2015 to September 2015, during which capacity expanded 1.6 million barrels (2%).

The expansion of crude oil storage capacity helped to accommodate the growth in U.S. crude oil inventories, which surpassed 500 million barrels at the end of January 2016. U.S. crude oil inventories increased in 24 of the 30 weeks from September to March, and were 532 million barrels for the week ending June 3.

Despite the large expansion in crude oil storage capacity, the net effect of capacity growth and increased inventories resulted in high storage utilization rates. Storage utilization at Cushing averaged 88% over the past four weeks, compared with 81% for the same period last year. PADD 3 storage utilization rates averaged 73% over the past four weeks, after having never surpassed 70% in the previous four years. (Figure 2).

U.S. average regular gasoline retail and diesel fuel prices increase

The U.S. average regular gasoline retail price increased four cents from the previous week to $2.38 per gallon on June 6, down 40 cents from the same time last year. The Midwest price increased seven cents to $2.41 per gallon, followed by the Gulf Coast, up five cents to $2.14 per gallon. The West Coast and East Coast prices each rose three cents to $2.70 per gallon and $2.31 per gallon, respectively. The Rocky Mountain price dipped slightly to $2.31 per gallon.

The U.S. average diesel fuel price increased three cents from a week ago to $2.41 per gallon, down 48 cents from the same time last year. The West Coast and East Coast prices each rose three cents to $2.68 per gallon and $2.44 per gallon, respectively. The Rocky Mountain, Midwest, and Gulf Coast prices each increased by two cents to $2.39 per gallon, $2.36 per gallon, and $2.28 per gallon, respectively.

Propane inventories gain

U.S. propane stocks increased by 1.9 million barrels last week to 77.3 million barrels as of June 3, 2016, 1.5 million barrels (1.9%) lower than a year ago. Gulf Coast, Midwest, and East Coast inventories increased by 1.4 million barrels, 0.5 million barrels, and 0.3 million barrels, respectively. Rocky Mountain/West Coast inventories decreased by 0.2 million barrels. Propylene non-fuel-use inventories represented 4.6% of total propane inventories

For questions about This Week in Petroleum, contact the Petroleum Markets Team at 202-586-4522.


Retail prices (dollars per gallon)

Conventional Regular Gasoline Prices Graph.On-Highway Diesel Fuel Prices Graph.
Gasoline 2.381 0.042 -0.399
Diesel 2.407 0.025 -0.477

Futures prices (dollars per gallon*)

Crude oil 48.62 -0.71 -10.51
Gasoline 1.608 -0.024 -0.422
Heating oil 1.488 -0.006 -0.382
*Note: Crude oil price in dollars per barrel.

Stocks (million barrels)

Crude oil 532.5 -3.2 61.9
Gasoline 239.6 1.0 22.3
Distillate 151.4 1.8 17.9
Propane 77.294 1.913 -1.501

Recent drilling activity has lowered costs and increased performance (6/2/2016)

Release date: June 2, 2016  |  Next release date: June 8, 2016

Recent drilling activity has lowered costs and increased performance

The profitability of oil and natural gas development activity depends both on the prices realized by producers and the cost and productivity of newly developed wells. Overall trends in well development costs are generally less transparent than those in price and productivity, which are readily observable in the markets or through analyses of well productivity trends such as EIA’s monthly Drilling Productivity Report.

To better understand the costs of upstream (or, wellhead) drilling and production activity, the U.S. Energy Information Administration (EIA) commissioned IHS Global Inc. (IHS) to study these costs on a per-well basis in the Bakken, Eagle Ford, and Marcellus plays, two plays within the Permian Basin (Midland and Delaware), and the offshore federal Gulf of Mexico (GOM). The IHS study finds that upstream costs in 2015 for the onshore plays were 25% to 30% below their 2012 levels, when per-well costs were at their highest point over the past decade, and 16% to 20% lower than the average of the past five years (Figure 1).

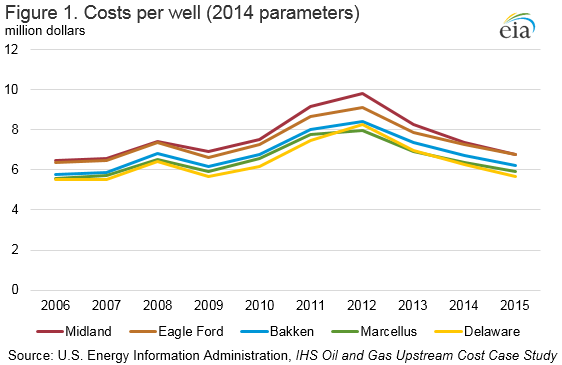
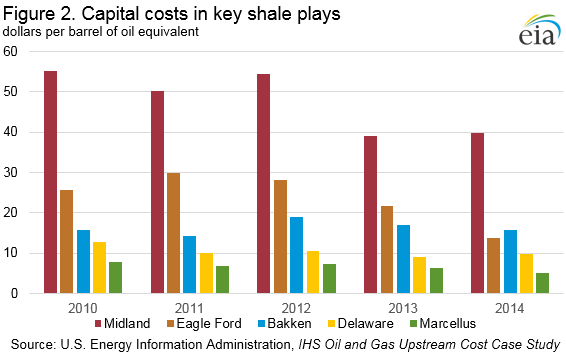
Changes in technology have improved drilling efficiency and completion, supporting higher productivity per well, but shifts toward deeper and longer lateral wells with more complex completions have tended to increase costs. To assess upstream costs of developing these plays in economic terms, the study applied the term unit cost, which compares capital expenditure with expected well performance to measure effectiveness, calculated as cost per barrel of oil equivalent (BOE) produced. Although some drilling costs have increased, the resulting performance benefit per well more than offsets those increases, leading to an overall decrease in cost per BOE produced (Figure 2). The unit cost concept does not, however, factor in the market value of the oil and gas produced from these wells, which is important for calculating net present value of profit or loss.

The use of multiwell pad drilling, more efficient fracturing and service providers, and decreased drilling times have all contributed to cost savings. At the same time, the use of longer laterals, better geo-steering to stay within the targeted formation, increased quantities of proppant use (to keep the fractured spaces open), an increased number and density of fracturing stages, and spacing optimization have increased well performance. Since oil prices started falling in mid-2014, reduced demand for drilling services has also enabled operators to renegotiate contracts with service providers, resulting in lower costs for drilling and well completions. Additionally, costs vary across the studied areas because of differences in geology, well depth, and water disposal options.

In the Bakken, lateral well lengths have increased to just under 10,000 feet to achieve a balance between cost and estimated ultimate recovery (EUR). Producers have also increased the quantity of proppant and fluids used at each stage, and a switch in the type of fracturing fluids. The type of proppant varies from expensive ceramic sand to cheaper natural sand between subplays, but is expected to move more toward natural sand. Well design and technology are expected to improve, but application of more proppant is not substantially increasing EURs, suggesting that as oil prices dropped in 2015, drilling operators switched to focusing on geological sweet spots rather than technological improvements to maintain production performance. Gathering, processing, and transport costs are high in this region because of infrastructure constraints associated with distance to markets and transportation being limited to rail (which can cost $5-$7 more per barrel than pipeline transport).

In the Eagle Ford, lateral lengths of wells have increased to 6,400 feet, while proppant and fracturing fluid quantities per stage have grown. Proppant mixes are focusing on cheaper, natural proppant allowing an economical increase of proppant. Also, more wells are being drilled on multiwell pads, allowing savings from shared facilities, roads, and water disposal systems. Unlike in the Bakken, an increased use of proppant directly correlates with production performance and abundant infrastructure, and proximity to markets decreases operating and transportation costs. Furthermore, in a low crude oil price environment, the Eagle Ford also has optimal production from site-specific drilling.

Horizontal wells in the Delaware and the Midland basins have increased their lateral lengths to 5,600 feet and 7,300 feet, respectively, with further increases projected. The Delaware Basin completion designs support 20 fractured stages with more than 6.2 million pounds of mixed natural sand and ceramic proppant and 6.6 million gallons of gel-based fluid. The Midland Basin designs support 28 stages with 8.8 million pounds of natural sand proppant and 9.2 million gallons of either slick water (low viscous fluid, mixture of water and chemicals) or gel-based fluid, with water-based fluid becoming more popular. However, even with these improving well and completion designs that have increased the EUR, sustained low prices have left unit costs in the Delaware Basin fluctuating and in the Midland Basin declining. Although horizontal wells in these basins have diminished cost savings in recent years, the Midland Basin is projected to have as many as 24 horizontal wells drilled from a single pad, potentially reducing costs by $700,000 per well. Similarly, horizontal drilling in the Delaware is expected to see incremental efficiency gains as more wells are drilled from multiwell pads.

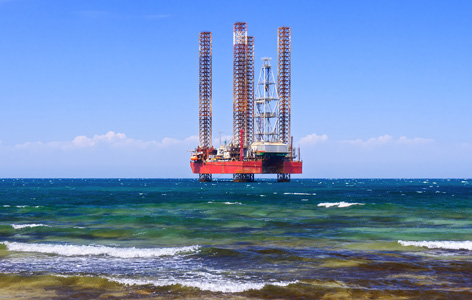
Offshore projects are typically more complex than onshore ones, as they can require construction and installation of infrastructure unique to the project, and take years to develop. There are fewer wells from which to examine historical and current costs and a larger variation in the costs themselves. To demonstrate the variability in project costs, the IHS study characterized the cost profiles of four deepwater GOM projects representing the different plays, development concepts, and technical challenges offshore operators encounter: Chevron’s Big Foot ($4.3 billion), Anadarko’s Lucius ($2.47 billion), Deep Gulf Energy’s Kodiak ($1.2 billion), and Chevron’s Jack/St. Malo ($12 billion). Jack/St. Malo came online in 2014 and Lucius in 2015; Kodiak and Big Foot are anticipated to come online in 2016 and 2018, respectively.

The study delineated the main cost components of offshore projects and analyzed the key drivers behind each. The costs of drilling and completing wells in deepwater are driven by water depth, well depth, and reservoir quality, complexity, and productivity. The costs associated with constructing and installing the selected development concept are driven by design, reserve size, water depth, technical challenges, and infrastructure availability or proximity. The costs of laying pipeline used to transport processed oil and natural gas to an existing platform or onshore facility are driven by water depth, length, diameter, and capacity. Finally, the operating and decommissioning costs depend on the development concept.

Looking to 2018, with the significant capital investment offshore projects require and the current oil price environment, offshore operators are especially focused on reducing costs, increasing efficiency, and improving project economics. The IHS study estimates that a reduction in capital expenditure of at least 20% is required to move yet-to-be-funded projects in the most technically challenging play in the GOM to a $60/barrel breakeven. The study forecasts a 15% reduction in deepwater costs in 2015, an additional 3% reduction in 2016, and a modest rise in costs from 2017 to 2020.

U.S. average regular gasoline retail and diesel fuel prices rise

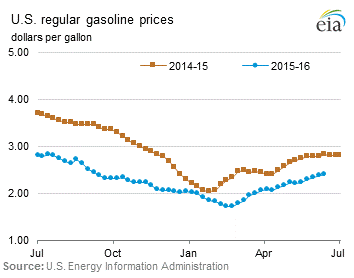
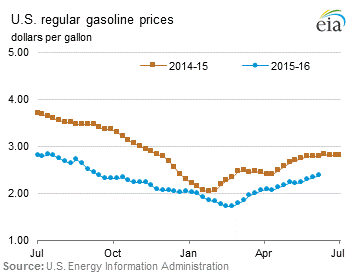
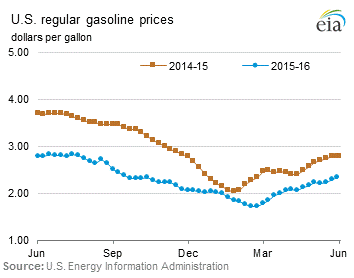
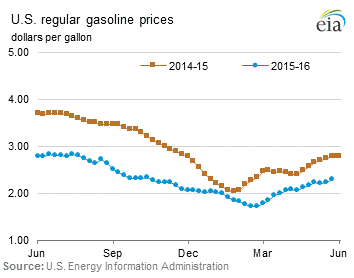
The U.S. average regular gasoline retail price increased four cents from the previous week to $2.34 per gallon on May 31, down 44 cents from the same time last year. The Midwest price increased six cents to $2.34 per gallon, followed by the East Coast, up four cents to $2.29 per gallon, and the Gulf Coast price, which rose three cents to $2.09 per gallon. The West Coast and Rocky Mountain prices each increased two cents to $2.67 per gallon and $2.32 per gallon, respectively.

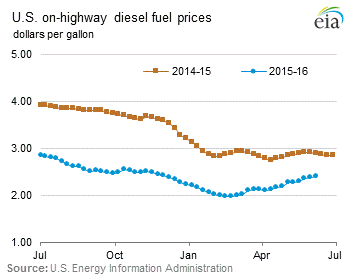
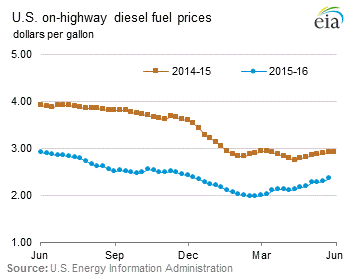
The U.S. average diesel fuel price increased three cents from a week ago to $2.38 per gallon, down 53 cents from the same time last year. The West Coast price rose five cents to $2.65 per gallon, followed by the East Coast price, which increased three cents to $2.41 per gallon. The Rocky Mountain, Midwest, and Gulf Coast prices each increased two cents to $2.38 per gallon, $2.34 per gallon, and $2.25 per gallon, respectively.

Propane inventories gain

U.S. propane stocks increased by 1.3 million barrels last week to 75.4 million barrels as of May 27, 2016, 1.7 million barrels (2.2%) lower than a year ago. Midwest and Rocky Mountain/West Coast inventories increased by 1.3 million barrels and 0.2 million barrels, respectively. Gulf Coast inventories decreased by 0.3 million barrels, while East Coast inventories remained virtually unchanged. Propylene non-fuel-use inventories represented 5.1% of total propane inventories.

For questions about This Week in Petroleum, contact the Petroleum Markets Team at 202-586-4522.


Retail prices (dollars per gallon)

Conventional Regular Gasoline Prices Graph.On-Highway Diesel Fuel Prices Graph.
Gasoline 2.339 0.039 -0.441
Diesel 2.382 0.025 -0.527

Futures prices (dollars per gallon*)

Crude oil 49.33 1.58 -10.97
Gasoline 1.632 -0.004 -0.454
Heating oil 1.494 0.004 -0.461
*Note: Crude oil price in dollars per barrel.

Stocks (million barrels)

Crude oil 535.7 -1.4 58.3
Gasoline 238.6 -1.5 18.3
Distillate 149.6 -1.3 17.0
Propane 75.381 1.252 -1.665

IEA releases Oil Market Report for June

Unexpected supply cuts and outages in North America, Africa and South America dampen global production forecasts

14 June 2016

Outages in OPEC and non-OPEC countries cut global oil supply by nearly 0.8 mb/d in May. At 95.4 mb/d, output stood 590 kb/d below a year earlier – the first significant drop since early 2013. Non-OPEC supply growth is expected to return in 2017 at a modest 0.2 mb/d, after declining by 0.9 mb/d in 2016, the newly released IEA Oil Market Report  (OMR) for June informs subscribers.
 
OPEC crude output fell by 110 kb/d in May to 32.61 mb/d as big losses in Nigeria due to oil sector sabotage more than offset higher Middle East output. Iran has clearly emerged as OPEC’s fastest source of supply growth this year, with an anticipated gain of 700 kb/d.
 
Global oil demand growth in 1Q16 has been revised upwards to 1.6 mb/d and for 2016 growth will now be 1.3 mb/d. In 2017 we will see the same rate of growth and global demand will reach 97.4 mb/d. Non-OECD nations will provide most of the expected gains in both years. The growth rate is slightly above the previous trend, mostly due to relatively low crude oil prices.
 
Commercial inventories in the OECD increased from March levels by 14.4 mb to stand at 3 065 mb by end-April, an impressive 222 mb above one year earlier. As the US driving season kicks off, OECD gasoline stocks stand above average levels and last year in absolute and days of forward demand terms. There is a similar picture in China.
 
Refinery runs in 2Q16 are suffering from deepening outages. Throughput is nearly flat year-on-year, as refiners finally catch up with maintenance postponed from 2015. The seasonal ramp-up to 3Q16 is expected to be the largest on record, surging by about 2.3 mb/d quarter-on-quarter.

 The Oil Market Report (OMR) is a monthly International Energy Agency publication which provides a view of the state of the international oil market and projections for oil supply and demand 12-18 months ahead. To subscribe, click here.

Photo: © Shutterstock.com

Oil companies focus on production over exploration as low oil prices reduce value of new reserves (5/25/2016)

Release date: May 25, 2016  |  Next release date: June 2, 2016

Oil companies focus on production over exploration as low oil prices reduce value of new reserves

For the second consecutive year, oil companies worldwide produced more oil and natural gas than they added to their proved reserves, excluding revisions to existing proved reserves and purchases of reserves in place. This is not necessarily an indication of fewer available resources, but rather that at current prices, there are fewer resources that can be turned into proved reserves, which are underground oil and gas that can be commercially produced at current prices using currently available technology.

Based on analysis of recently released annual reports, 85 publicly traded companies added a total of 13.7 billion barrels of oil equivalent (BOE) to their reserves base, three-quarters of the amount the same group of companies produced in 2015. A combination of reductions in exploration and development (E&D) investment and fewer extensions and discoveries contributed to the decline. Of the companies that submitted first-quarter 2016 financial results, capital expenditures declined 35% from first-quarter 2015, suggesting continued reductions in E&D investment, which could reduce reserves additions in 2016.

The reserves replacement ratio—the ratio of proved reserves added during a given year to production for that year—indicates the extent to which a company is replacing its produced reserves (Figure 1). The group of 85 companies as a whole had a reserves replacement ratio of approximately 100% in 2012 and 2013, and around 75% for 2014 and 2015. However, the ratios vary significantly by company type. Only the U.S. onshore companies added more reserves to their collective portfolio than they produced in 2015, but the effect on the global reserves base is modest because these companies hold a relatively small share of proved reserves and production.

Each company grouping differs by its area of operations and the types of assets in its portfolio. State-owned companies are mostly national oil companies outside of the Organization of the Petroleum Exporting Countries (OPEC). The international/integrated oil companies are large producers that have refining and midstream assets, with global portfolios of onshore and offshore oil production. The North American mixed companies are U.S. and Canadian exploration and production (E&P) companies that are smaller producers but with fairly broad portfolios geographically and by production type, including shale, oil sands, and offshore. The U.S. onshore producers are smaller E&P companies that focus mainly on onshore production in the United States. Collectively, the 85 companies produced 50 million BOE per day in 2015, two-thirds of which was crude oil and the remainder being natural gas and hydrocarbon gas liquids.

Analysis by major area of operations and production portfolio also reveals volumetric differences in reserves additions (Figure 2). State-owned companies and international/integrated oil companies increased reserves additions in 2015, while North American companies with a mixed production portfolio and U.S. onshore companies added less than in 2014. Companies can add proved reserves through new discoveries, enlargement of a reservoir’s proved area (extensions), improvements in the recovery of existing reserves, purchases of another company’s proved reserves, or revisions of existing reserves for economic or technical reasons. For the purposes of this analysis, purchases of reserves in place and reserves revisions are excluded from the calculation of reserves additions.

Expenditures for E&D constitute most of a company’s upstream capital investment. When calculated on a reserve addition per barrel basis, these expenditures represent the cost of finding and developing a barrel of oil. Finding and developing costs declined $10.23/BOE in 2015 (Figure 3). Since there may be a timing mismatch between when an expenditure is made and when a proved reserve addition is formally recognized, standard practice is to average the results over several years. Finding and developing costs for these companies were $25.69/BOE in 2015, the lowest in the 2012-15 period and lower than the four-year average of $29.25/BOE.

Similar to the reserves additions and the reserves replacement ratio, finding and developing costs differed across the company groupings. In recent years, U.S. onshore companies tended to have lower E&D expenditures per reserve addition compared with the other groups, as many reserves additions came from geologically familiar shale basins in the United States. Other producers typically operate in areas where it is more challenging to find reserves, such as deepwater offshore or in more mature fields that are the foundation of legacy production (such as in China or Russia). The decline in E&D expenditures for national oil companies and international/integrated companies suggests a reduction in exploration activity in such high-cost areas.

With most companies indicating continued reductions in E&D budgets absent a meaningful increase in crude oil prices, proved reserves additions will likely continue to decline.

U.S. average regular gasoline retail and diesel fuel prices increase

The U.S. average regular gasoline retail price increased six cents from the previous week to $2.30 per gallon on May 23, down 47 cents from the same time last year. The Midwest price increased 10 cents to $2.28 per gallon, followed by the Gulf Coast, up eight cents to $2.06 per gallon. The Rocky Mountain price rose six cents to $2.30 per gallon, the East Coast price increased three cents to $2.25 per gallon, and the West Coast price rose one cent to $2.66 per gallon.

The U.S. average diesel fuel price increased six cents from a week ago to $2.36 per gallon, down 56 cents from the same time last year. The Gulf Coast price rose eight cents to $2.23 per gallon, followed by the West Coast price, which increased seven cents to $2.60 per gallon. The East Coast price increased six cents to $2.38 per gallon, the Midwest price rose five cents to $2.33 per gallon, and the Rocky Mountain price was up three cents to $2.36 per gallon.

Propane inventories fall slightly

U.S. propane stocks decreased by 0.1 million barrels last week to 74.1 million barrels as of May 20, 2016, 0.9 million barrels (1.2%) higher than a year ago. East Coast and Gulf Coast inventories decreased by 0.2 million barrels and 0.1 million barrels, respectively. Midwest inventories increased by 0.2 million barrels, while Rocky Mountain/West Coast inventories remained unchanged. Propylene non-fuel-use inventories represented 5.4% of total propane inventories.

For questions about This Week in Petroleum, contact the Petroleum Markets Team at 202-586-4522.


Retail prices (dollars per gallon)

Conventional Regular Gasoline Prices Graph.On-Highway Diesel Fuel Prices Graph.
Gasoline 2.300 0.058 -0.474
Diesel 2.357 0.060 -0.557

Futures prices (dollars per gallon*)

Crude oil 47.75 1.54 -11.97
Gasoline 1.636 0.048 -0.418
Heating oil 1.490 0.087 -0.463
*Note: Crude oil price in dollars per barrel.

Stocks (million barrels)

Crude oil 537.1 -4.2 57.7
Gasoline 240.1 2.0 19.5
Distillate 150.9 -1.3 22.0
Propane 74.129 -0.087 0.911