Release date: June 8, 2016 | Next release date: June 15, 2016
Storage capacity utilization rises, as growth in stored volumes outpaces expansion of storage capacity
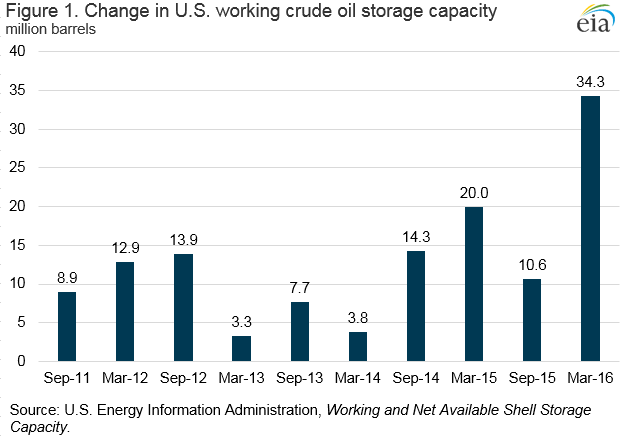
The United States added 34 million barrels (6%) of working crude oil storage capacity from September 2015 to March 2016, the largest expansion of commercial crude oil storage capacity since EIA began tracking such data in 2011 (Figure 1). At the same time, reported weekly U.S. commercial crude inventories have increased by more than 72 million barrels (16%) since September, which implies crude oil storage capacity utilization at a record high of 74% for the week ending June 3.
Storage and capacity volumes used to calculate storage utilization rates must be comparable in scope to provide accurate estimates. Weekly U.S. crude inventories include volumes in transit by pipeline, tanker, barge and rail, and lease stocks. To facilitate accurate utilization calculations, EIA’s biannual Working and Net Available Shell Storage Capacity Report, which is released with March and September data, now provides information on the sum of working storage capacity, stocks in transit by pipeline, tanker, barge and rail, and lease stocks. This tally provides a capacity estimate with the same scope as commercial inventories reported by EIA for use as the denominator when calculating storage capacity utilization. Simply dividing total commercial inventories by working storage capacity alone would overstate utilization because it does not account for the volume of crude oil stored outside of tankage (pipeline fill and stocks in transit). Using weekly data, crude oil storage capacity utilization can be estimated by subtracting the amount of Alaskan crude oil in transit from commercial inventories, then dividing by the sum of working storage capacity, stocks in transit, and pipeline fill from the most recently available Working and Net Available Shell Storage Capacity Report.
The large increase in crude storage capacity between September and March was prompted by increased demand for crude oil storage as global supply has outpaced global demand for most of the past two years. Because of generally rising crude oil inventories since the end of 2014, the structure of crude oil futures prices has been in steep contango, where near-term deliveries are discounted versus long-term deliveries. The Nymex West Texas Intermediate (WTI) 1-13 spread averaged $7.25 per barrel between September and March. The large and continued contango structure prompted many market participants to place more crude oil into storage.
The largest commercial crude oil storage capacity expansions were in Petroleum Administration for Defense Districts (PADD) 2 (Midwest) and 3 (Gulf Coast), 19 million barrels (13%) and 13 million barrels (4%), respectively. Combined, PADDs 2 and 3 represent 82% of total U.S. commercial crude oil storage capacity. Within PADD 2, storage capacity at Cushing, Oklahoma, the delivery point for the Nymex WTI futures contract, expanded 1.5 million barrels (2%), similar to the previous period of March 2015 to September 2015, during which capacity expanded 1.6 million barrels (2%).
The expansion of crude oil storage capacity helped to accommodate the growth in U.S. crude oil inventories, which surpassed 500 million barrels at the end of January 2016. U.S. crude oil inventories increased in 24 of the 30 weeks from September to March, and were 532 million barrels for the week ending June 3.
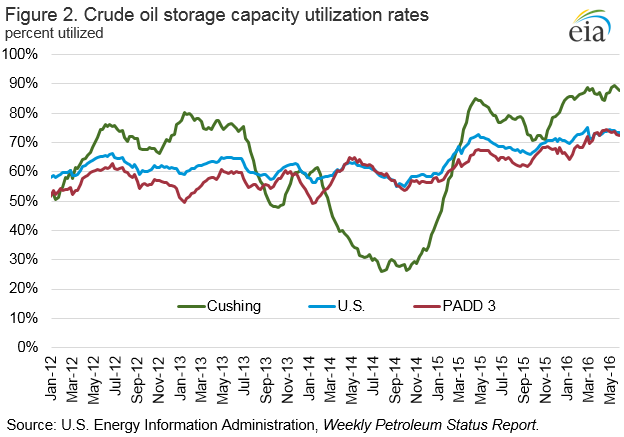
Despite the large expansion in crude oil storage capacity, the net effect of capacity growth and increased inventories resulted in high storage utilization rates. Storage utilization at Cushing averaged 88% over the past four weeks, compared with 81% for the same period last year. PADD 3 storage utilization rates averaged 73% over the past four weeks, after having never surpassed 70% in the previous four years. (Figure 2).
U.S. average regular gasoline retail and diesel fuel prices increase
The U.S. average regular gasoline retail price increased four cents from the previous week to $2.38 per gallon on June 6, down 40 cents from the same time last year. The Midwest price increased seven cents to $2.41 per gallon, followed by the Gulf Coast, up five cents to $2.14 per gallon. The West Coast and East Coast prices each rose three cents to $2.70 per gallon and $2.31 per gallon, respectively. The Rocky Mountain price dipped slightly to $2.31 per gallon.
The U.S. average diesel fuel price increased three cents from a week ago to $2.41 per gallon, down 48 cents from the same time last year. The West Coast and East Coast prices each rose three cents to $2.68 per gallon and $2.44 per gallon, respectively. The Rocky Mountain, Midwest, and Gulf Coast prices each increased by two cents to $2.39 per gallon, $2.36 per gallon, and $2.28 per gallon, respectively.
Propane inventories gain
U.S. propane stocks increased by 1.9 million barrels last week to 77.3 million barrels as of June 3, 2016, 1.5 million barrels (1.9%) lower than a year ago. Gulf Coast, Midwest, and East Coast inventories increased by 1.4 million barrels, 0.5 million barrels, and 0.3 million barrels, respectively. Rocky Mountain/West Coast inventories decreased by 0.2 million barrels. Propylene non-fuel-use inventories represented 4.6% of total propane inventories
For questions about This Week in Petroleum, contact the Petroleum Markets Team at 202-586-4522.
Retail prices (dollars per gallon)
| Gasoline | 2.381 | 0.042 | -0.399 |
| Diesel | 2.407 | 0.025 | -0.477 |
Futures prices (dollars per gallon*)
| Crude oil | 48.62 | -0.71 | -10.51 |
| Gasoline | 1.608 | -0.024 | -0.422 |
| Heating oil | 1.488 | -0.006 | -0.382 |
| *Note: Crude oil price in dollars per barrel. | |||
Stocks (million barrels)
| Crude oil | 532.5 | -3.2 | 61.9 |
| Gasoline | 239.6 | 1.0 | 22.3 |
| Distillate | 151.4 | 1.8 | 17.9 |
| Propane | 77.294 | 1.913 | -1.501 |