IEA brings together energy efficiency experts from across the globe

Over 100 participants from emerging and developing countries gather in Paris for training and discussion on energy efficiency policy

6 June 2016

Inaugurated in 2015, the annual IEA Energy Efficiency in Emerging Economies Training event is the only one in the world dedicated to sharing experiences and promoting best practices for planning, implementing and evaluating energy efficiency policies in emerging economies. This year’s edition brought together over 100 participants from more than 40 emerging and developing countries, representing more than over half of the world’s total final energy consumption.

In opening the event, IEA Executive Director Dr Fatih Birol reiterated the importance of the world’s “first fuel” for managing rising energy demand in a more cost-effective, sustainable and secure manner. He also stated the IEA’s commitment to becoming a global voice on energy efficiency.

The participants – energy efficiency professionals with expertise across a variety of sectors – will spend 3 days following in-depth training on energy efficiency policies for different end-use sectors: buildings, industry, transport, or lighting, appliances and equipment. The courses will feature sessions on prioritisation, toolkits for successful programmes, and best resources for implementation, monitoring and modification. The first session on “The Global Opportunity for Energy Efficiency” began with high-level interventions by  Ambassadors to the OECD from the Netherlands, Australia and Canada, as well as Brian Motherway, IEA Head of Energy Efficiency, Mark Radka, UNEP Head of Energy, Climate, and Technology and Nigel Jollands of the European Bank for Reconstruction and Development.

Site visits for each sector will provide participants the opportunity to see first-hand how energy efficiency measures are being implemented on the ground. The visits will include Bouygues Construction, Schneider Electric and Autolib.

The final day will focus on the theme of “Making More Energy Efficiency Happen”, including sessions on policy evaluation from “Strategy Development Solutions” as well as interventions from the World Bank on the role of communication strategies in supporting energy efficiency goals.

Over the past six years, more than 2 000 people from around the world have taken part in IEA Energy Training and Capacity Building Programme events, all targeted at central government officials and key national stakeholders, such as governmental executive agencies and the private sector.

Join the conversation at #EnergyEfficientWorld


Report: Foreign Direct Investment in SoCal

Today, LAEDC affiliate World Trade Center LA released a report on the role of Foreign Direct Investment in the Southern California region.

Read the report HERE

Read media coverage:

LA Daily News:  What growing global trade means for Los Angeles area businesses

KPCC:  Which country invests most in LA? The answer might surprise you

FDI cover

WTCLA Report: Foreign Direct Investment Plays Significant Role in SoCal

 LOS ANGELES, CA – (June 17, 2016) Today, at the SELECT LA Investment Summit, the World Trade Center Los Angeles (WTCLA) published a new report on the impact of Foreign Direct Investment (FDI) to the Southern California (SoCal) economy, revealing the number of foreign-owned establishments in the region and the jobs created by those employers, and ranking countries based on investment levels in the SoCal region.

The report, sponsored by Chair of L.A. County Board of Supervisors Hilda L. Solis in collaboration with JPMorgan Chase and other firms, underscores the tremendous amount of international connections that are essential to economic activities and jobs here in SoCal and L.A. County.  The research was conducted by WTCLA affiliate LAEDC.

Findings of the report include:

  • There are 9,105 foreign owned firms in SoCal, which directly employ 366,415 people, who receive estimated wages of $23.6 billion/yr. The economic impact of this activity sustains 8.1% of all jobs in SoCal (direct, indirect, and induced jobs).
  • Manufacturing is the sector in which foreign owned firms employ the most workers in SoCal, with 116,721 workers, providing $6.8 billion in estimated wages.
  • Foreign-owned enterprises in SoCal most commonly originate from 1) Japan with 2,440 firms and 79,421 jobs, 2) United Kingdom with 1,145 firms and 54,910 jobs, and 3) Germany with 825 firms and 32,594 jobs.
  • Over the period of study, China was a relatively minor source of investment in SoCal until 2013 and 2014, years when investment rose dramatically to $1.1 billion and $1.5 billion, respectively. A. County received the bulk of that investment.
  • In 2015, California had the most foreign investment “greenfield” projects of any state in the U.S., with 230 projects. New York ranked second (192) and Texas ranked third (147).  In terms of total project value, California ranked fourth ($4 billion), with New York ranked first ($8.8 billion).
  • Foreign investments in “greenfield” projects in SoCal totaled more than $29 billion from 2003-2015.
  • The report also isolates the data specifically for the counties of Los Angeles, Orange, San Diego, San Bernardino, Riverside, and Ventura.

“In this global economy, the L.A. region is uniquely suited and appealing to foreign investors,” said Supervisor Solis. “Our draw combined with our international connections result in jobs and economic opportunity that provide benefits locally and throughout Southern California.”

As part of its commitment to foreign-direct investment in the region, JPMorgan Chase contributed $230,000 to WTCLA today to advance this effort.

“It’s eye opening to learn there are almost 10,000 foreign-owned firms in SoCal, employing more than a quarter of a million people,” said Joni Topper, Managing Director, JPMorgan Chase Commercial Bank Los Angeles. “Los Angeles is competing on a global stage and our competitors for jobs and investment are putting their best feet forward as regions, with solutions. We too must understand and embrace that when investment comes to Riverside and San Bernardino, to Ventura, or to Orange and San Diego Counties – Southern California benefits as a whole.“

The report release coincides with the 2016 SELECT LA Investment Summit, hosted by LAEDC affiliate World Trade Center Los Angeles.

In addition to the FDI report, WTCLA affiliate LAEDC also released its annual International Trade Outlook at SELECT LA.  For details, visit www.LAEDC.org.

About World Trade Center Los Angeles (WTCLA)

As the leading international trade service and promotion organization in the Los Angeles region, WTCLA supports the development of international trade and business opportunities through our business assistance, matchmaking and educational services, and promotes Los Angeles as the premier destination for international trade and foreign investment. WTCLA has led or assisted in the attraction of more than $1 billion of foreign investment into Los Angeles County. The WTCLA is an affiliate of the Los Angeles County Economic Development Corporation (LAEDC).  www.WTCLA.org

About the LAEDC

The Los Angeles County Economic Development Corporation (LAEDC) provides strategic economic development leadership to promote a globally competitive, prosperous and growing L.A. County economy to improve the health and wellbeing of our residents and communities and enable those residents to meet their basic human need for a job.  We achieve this through objective economic research and analysis, strategic assistance to government and business, and targeted public policy.  Our efforts are guided and supported by the expertise and counsel of our business, government and education members and partners.  www.LAEDC.org

Media Contact:   Lawren Markle / 213-236-4847 / [email protected]

Report: International Trade Outlook for Los Angeles region

LAEDC has released the 2016-2017 International Trade Outlook, providing and overview and forecast for this important industry in the Los Angeles region.

Read the report HERE 

ITO coverRead media coverage:

LA Daily News:  What growing global trade means for Los Angeles area businesses

KPCC:  Which country invests most in LA? The answer might surprise you

This edition is the 11th Annual International Trade Outlook from LAEDC.  To learn more about this industry cluster visit LAEDC’s page HERE.

During 2016, LAEDC will also be producing an industry cluster report on the Trade and Logistics industry cluster of our region.

Clean Power Plan accelerates the growth of renewable generation throughout United States

June 17, 2016graph of U.S. net electricity generation by fuel, as explained in the article text


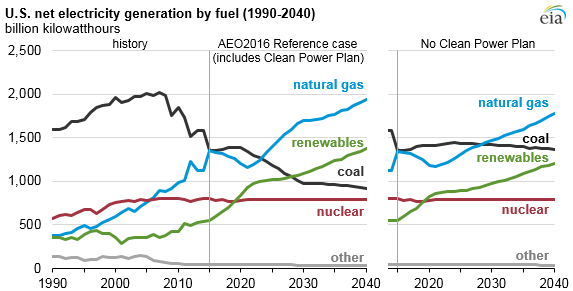
EIA’s Annual Energy Outlook 2016 (AEO2016) Reference case projects that natural gas-fired electricity generation will exceed coal-fired electricity generation by 2022, while generation from renewables—driven by wind and solar—will overtake coal-fired generation by 2029. The shift away from coal-fired generation to a combination of higher natural gas-fired and renewables generation and greater energy efficiency is expected to be accelerated by the U.S. Environmental Protection Agency’s Clean Power Plan (CPP).

Notably, the share of natural gas-fired generation exceeded coal-fired generation in 2016, according to EIA’s latest Short-Term Energy Outlook. However, in the AEO2016 Reference case, the natural gas-fired share of generation declines temporarily after 2016, then resumes rising in about 2020 and once again exceeds the coal-fired share in 2022 and throughout the rest of the AEO2016 projection to 2040.

Even without the CPP, significant growth in renewables generation is projected throughout the country, due in large part to Congress’s recent extension of favorable tax treatment for renewable energy sources. From 2015 to 2030, for the nation as a whole in a scenario where the CPP is never implemented, EIA projects that renewables generation will increase at an annual average rate of 3.9%, while natural gas generation will grow at 0.6% per year. In the Reference case, which assumes the implementation of the Clean Power Plan, renewables and natural-gas fired generation grow at 4.7% and 1.6% annually from 2015 to 2030, respectively.

In the final version of the CPP, states with higher intensity levels generally have greater requirements for reduction of CO2 emissions.

graph of electricity market regions and carbon dioxide emissions rate by region, as explained in the article text


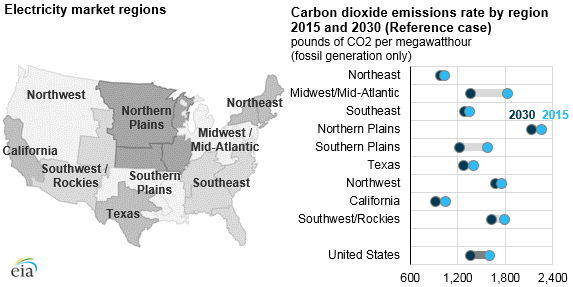
EIA’s analysis of the U.S. electricity market is divided into 22 regions, which in this discussion are further reduced to 9 regions shown above. The current generation mix across these regions varies considerably, with significant differences in the use of fossil-fuel, nuclear, and renewable energy sources.

graph of regional electricity generation by fuel, as explained in the article text


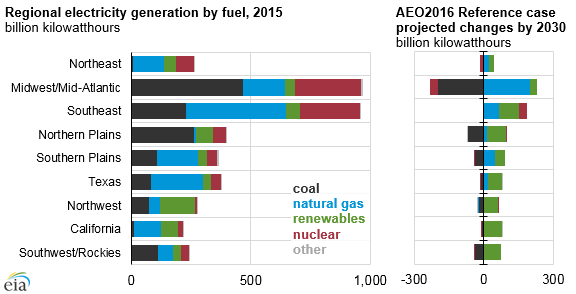
Certain regions such as the Midwest/Mid-Atlantic, Southwest/Rockies, and Northern Plains—regions that are home to much of U.S. coal production—tend to have greater reliance on coal-fired electricity generation. These regions have among the highest CO2 reduction requirements and are expected to have the largest shifts in their generation mix. In the Midwest/Mid-Atlantic region, a large decline in coal generation is offset by an increase in natural gas generation and relatively modest growth in renewable generation. These projected changes are expected to result in a 26% decline in the Midwest / Mid-Atlantic region’s emission rate—from 1,826 to 1,357 pounds of CO2 per megawatthour, the largest drop of any region in both percentage and absolute terms.

The Southwest/Rockies region is projected to see an expansion of renewables generation that is nearly twice as large as the decline in coal generation. In the Northern Plains region, a decline in coal generation is exceeded by a slightly larger shift to renewables generation, with smaller growth in natural gas generation. Other regions, such as Texas, the Southern Plains, and the Southeast, rely more on natural gas-fired generation. The projected decline in these regions’ coal generation is more modest, and they all are expected to see strong gains in renewables generation, with some additional growth in natural gas generation.

Finally, the Northeast region and California currently have almost no coal generation and meet most of their demand with natural gas generation, along with renewables generation in California and a mix of nuclear and renewables generation in the Northeast. While the Northwest region does have some coal generation, it has the largest renewable generation total of any region because of its extensive hydroelectric resources. These regions have among the lowest emission reduction requirements, and as a result are expected to register small or no change in generation mix as a result of the CPP.

California sees strong growth in renewable generation by 2030 as a result of the state renewable targets. Similarly, the Northwest region is expected to increase renewables generation as well. The Northeast shows an increase in both natural gas and renewables generation by 2030, and a small decline in nuclear generation due to planned retirements.

The Reference case assumes that all states implement the Clean Power Plan using a mass-based standard that caps emissions from both existing and new plants, with allowance revenues rebated to rate payers. Because the plan allows flexibility in implementation approaches, EIA produced several alternative cases that consider how outcomes change with different implementation approaches, and in a scenario with tighter standards beyond 2030. Compliance decisions by the states (as well as any future court decision that would vacate the rule) have implications for plant retirements, capacity additions, and generation by fuel type, demand, and prices. An AEO2016 Issues in focus article released early next week will explore the results of this analysis.

Principal contributors: Thad Huetteman, Laura Martin

Measuring the value of next-generation wind and solar power

As next-generation wind and solar power grows in the energy mix, a focus on their falling generation costs alone stops short of what is needed

2 June 2016

In a paper released today on the side-lines of the Clean Energy Ministerial in San Francisco, the International Energy Agency argues that a new phase of deployment in wind and solar photovoltaics (PV) – currently the fastest-growing sources of electricity globally – is emerging, in which wind and solar PV are technologically mature and economically affordable. However electricity generation from both technologies is constrained by the varying availability of wind and sunshine, which can make it more difficult to maintain the necessary balance between electricity supply and consumption.

As these variable renewables enter this next generation of deployment, the issue of system and market integration becomes a critical priority for renewables policy and energy policy more broadly. The paper highlights that this will require strategic action in three areas:

• System-friendly deployment, aiming to maximise the net benefit of wind and solar power for the entire system
• Improved operating strategies, such as advanced renewable energy forecasting and enhanced scheduling of power plants
• Investment in additional flexible resources, comprising demand-side resources, electricity storage, grid infrastructure and flexible generation

In addition, the paper argues that unlocking the contribution of system-friendly deployment calls for a paradigm shift in the economic assessment of wind and solar power. The traditional focus on the levelised cost of electricity (LCOE) – a measure of cost for a particular generating technology at the level of a power plant – is no longer sufficient. Next-generation approaches need to factor in the system value of electricity from wind and solar power – the overall benefit arising from the addition of a wind or solar power generation source to the power system. System value is determined by the interplay of positives and negatives including reduced fuel costs, reduced carbon dioxide and other pollutant emissions costs, or higher costs of additional grid infrastructure.

In addition to general analysis and recommendations, the paper also includes summaries of three case studies in China, Denmark and South Africa..

Next-Generation Wind and Solar Power: from Cost to Value
is available for free download here.


IEA releases Oil Market Report for June

Unexpected supply cuts and outages in North America, Africa and South America dampen global production forecasts

14 June 2016

Outages in OPEC and non-OPEC countries cut global oil supply by nearly 0.8 mb/d in May. At 95.4 mb/d, output stood 590 kb/d below a year earlier – the first significant drop since early 2013. Non-OPEC supply growth is expected to return in 2017 at a modest 0.2 mb/d, after declining by 0.9 mb/d in 2016, the newly released IEA Oil Market Report  (OMR) for June informs subscribers.

OPEC crude output fell by 110 kb/d in May to 32.61 mb/d as big losses in Nigeria due to oil sector sabotage more than offset higher Middle East output. Iran has clearly emerged as OPEC’s fastest source of supply growth this year, with an anticipated gain of 700 kb/d.

Global oil demand growth in 1Q16 has been revised upwards to 1.6 mb/d and for 2016 growth will now be 1.3 mb/d. In 2017 we will see the same rate of growth and global demand will reach 97.4 mb/d. Non-OECD nations will provide most of the expected gains in both years. The growth rate is slightly above the previous trend, mostly due to relatively low crude oil prices.

Commercial inventories in the OECD increased from March levels by 14.4 mb to stand at 3 065 mb by end-April, an impressive 222 mb above one year earlier. As the US driving season kicks off, OECD gasoline stocks stand above average levels and last year in absolute and days of forward demand terms. There is a similar picture in China.

Refinery runs in 2Q16 are suffering from deepening outages. Throughput is nearly flat year-on-year, as refiners finally catch up with maintenance postponed from 2015. The seasonal ramp-up to 3Q16 is expected to be the largest on record, surging by about 2.3 mb/d quarter-on-quarter.

 The Oil Market Report (OMR) is a monthly International Energy Agency publication which provides a view of the state of the international oil market and projections for oil supply and demand 12-18 months ahead. To subscribe, click here.

Photo: © Shutterstock.com

Carbon tax: Not what Robin Hood had in mind

There is often some fairly muddled logic spouted by those who work in the corridors of power on Capitol Hill, but even by Washington’s standards this one takes the cake: Rep. Jared Polis (D-CO) referring to a carbon tax as a “tax cut.”

As E&E Daily reported recently, in response to the House taking up a resolution opposing a carbon tax, Rep. Polis said “this is the first sign of momentum for a carbon tax cut — and you’ll hear me referring to it as a carbon tax cut because that’s essentially what it is: using carbon tax revenues to cut taxes for the American people.” By his logic, the carbon tax is like Robin Hood: robbing from the rich, giving to the poor.

Except that’s not quite true. To begin, the notion that raising taxes and then giving it back is somehow a tax cut is the sort of fuzzy thinking that could only take place in Washington, DC.

Second, does anybody really believe that 100 percent of this tax will be given back to the people? And finally, even if it is given back, it is highly likely that it will go to the government’s preferred group of consumers – the kind of affluent consumer that can afford to install solar panels and drive around in expensive (and subsidized) electric vehicles.

Rep. Polis can keep referring to a carbon tax as a “tax cut,” but repeating the same fallacy over and over again does not somehow make it true.

About The AuthorAFPM Communications provides insights from inside AFPM. To learn more about AFPM, visit AFPM.org.

This email address is being protected from spambots. You need JavaScript enabled to view it.

New Research Makes Divestment Folly Even Harder To Ignore

Further research from Arizona State University has been released today which highlights – yet again – just how damaging divestment will be for universities that bow to pressure from narrow-minded pressure groups, and shed their investments in fossil fuel companies.

Findings from Dr. Hendrik Bessembinder, a professor at ASU’s Carey School of Business, show that costs related to divestment have the potential to rob endowment funds of as much as 12 percent of their total value over a 20-year time frame. For large institutions, this could be as much as $7.4 billion, while medium-sized institutions could see a reduction of between $52 million and $298 million. For small institutions, the loss could stretch from $17 million to $89 million.

But the costs with divestment don’t stop at the loss of funds. Dr. Bessembinder’s findings show that heavy transaction and compliance costs will be incurred as fund managers sell off their fossil fuel holdings, as many of these are held in mutual funds, commingled funds and private equity funds. Substantial research and compliance costs will also be incurred as managers ensure their investments comply with their divestment goals.

Finally, the report also adds that the top 10 environmentally-focused funds charge management fees 10 basis points higher than their peers in the active management space, and 38 basis points higher than the passively-managed funds that long-term investors tend to favor.

As stark as these numbers are, they become even more grave when viewed in context. A 12 percent drop in endowment funds means a 12 percent drop in funds for the college. In turn, this means less money for research, fellowships, financial aid and professorships – among much, much more.

Although some reports state that the divestment movement has been “largely rebuffed,” pressure on campuses across the country to shed their fossil fuel investments still remains. However, while the divestment advocates claim to represent the best interests of American citizens, divestment merely politicizes energy production in favor of more expensive methods – harming the very people advocates think they are trying to save.

About The AuthorAFPM Communications provides insights from inside AFPM. To learn more about AFPM, visit AFPM.org.


Report: Foreign Direct Investment in SoCal

Today, LAEDC affiliate World Trade Center LA released a report on the role of Foreign Direct Investment in the Southern California region.

Read the report HERE

Read media coverage:

LA Daily News:  What growing global trade means for Los Angeles area businesses

KPCC:  Which country invests most in LA? The answer might surprise you

FDI cover

WTCLA Report: Foreign Direct Investment Plays Significant Role in SoCal

 LOS ANGELES, CA – (June 17, 2016) Today, at the SELECT LA Investment Summit, the World Trade Center Los Angeles (WTCLA) published a new report on the impact of Foreign Direct Investment (FDI) to the Southern California (SoCal) economy, revealing the number of foreign-owned establishments in the region and the jobs created by those employers, and ranking countries based on investment levels in the SoCal region.

The report, sponsored by Chair of L.A. County Board of Supervisors Hilda L. Solis in collaboration with JPMorgan Chase and other firms, underscores the tremendous amount of international connections that are essential to economic activities and jobs here in SoCal and L.A. County.  The research was conducted by WTCLA affiliate LAEDC.

Findings of the report include:

  • There are 9,105 foreign owned firms in SoCal, which directly employ 366,415 people, who receive estimated wages of $23.6 billion/yr. The economic impact of this activity sustains 8.1% of all jobs in SoCal (direct, indirect, and induced jobs).
  • Manufacturing is the sector in which foreign owned firms employ the most workers in SoCal, with 116,721 workers, providing $6.8 billion in estimated wages.
  • Foreign-owned enterprises in SoCal most commonly originate from 1) Japan with 2,440 firms and 79,421 jobs, 2) United Kingdom with 1,145 firms and 54,910 jobs, and 3) Germany with 825 firms and 32,594 jobs.
  • Over the period of study, China was a relatively minor source of investment in SoCal until 2013 and 2014, years when investment rose dramatically to $1.1 billion and $1.5 billion, respectively. A. County received the bulk of that investment.
  • In 2015, California had the most foreign investment “greenfield” projects of any state in the U.S., with 230 projects. New York ranked second (192) and Texas ranked third (147).  In terms of total project value, California ranked fourth ($4 billion), with New York ranked first ($8.8 billion).
  • Foreign investments in “greenfield” projects in SoCal totaled more than $29 billion from 2003-2015.
  • The report also isolates the data specifically for the counties of Los Angeles, Orange, San Diego, San Bernardino, Riverside, and Ventura.

“In this global economy, the L.A. region is uniquely suited and appealing to foreign investors,” said Supervisor Solis. “Our draw combined with our international connections result in jobs and economic opportunity that provide benefits locally and throughout Southern California.”

As part of its commitment to foreign-direct investment in the region, JPMorgan Chase contributed $230,000 to WTCLA today to advance this effort.

“It’s eye opening to learn there are almost 10,000 foreign-owned firms in SoCal, employing more than a quarter of a million people,” said Joni Topper, Managing Director, JPMorgan Chase Commercial Bank Los Angeles. “Los Angeles is competing on a global stage and our competitors for jobs and investment are putting their best feet forward as regions, with solutions. We too must understand and embrace that when investment comes to Riverside and San Bernardino, to Ventura, or to Orange and San Diego Counties – Southern California benefits as a whole.“

The report release coincides with the 2016 SELECT LA Investment Summit, hosted by LAEDC affiliate World Trade Center Los Angeles.

In addition to the FDI report, WTCLA affiliate LAEDC also released its annual International Trade Outlook at SELECT LA.  For details, visit www.LAEDC.org.

About World Trade Center Los Angeles (WTCLA)

As the leading international trade service and promotion organization in the Los Angeles region, WTCLA supports the development of international trade and business opportunities through our business assistance, matchmaking and educational services, and promotes Los Angeles as the premier destination for international trade and foreign investment. WTCLA has led or assisted in the attraction of more than $1 billion of foreign investment into Los Angeles County. The WTCLA is an affiliate of the Los Angeles County Economic Development Corporation (LAEDC).  www.WTCLA.org

About the LAEDC

The Los Angeles County Economic Development Corporation (LAEDC) provides strategic economic development leadership to promote a globally competitive, prosperous and growing L.A. County economy to improve the health and wellbeing of our residents and communities and enable those residents to meet their basic human need for a job.  We achieve this through objective economic research and analysis, strategic assistance to government and business, and targeted public policy.  Our efforts are guided and supported by the expertise and counsel of our business, government and education members and partners.  www.LAEDC.org

Media Contact:   Lawren Markle / 213-236-4847 / [email protected]

Report: International Trade Outlook for Los Angeles region

LAEDC has released the 2016-2017 International Trade Outlook, providing and overview and forecast for this important industry in the Los Angeles region.

Read the report HERE 

ITO coverRead media coverage:

LA Daily News:  What growing global trade means for Los Angeles area businesses

KPCC:  Which country invests most in LA? The answer might surprise you

This edition is the 11th Annual International Trade Outlook from LAEDC.  To learn more about this industry cluster visit LAEDC’s page HERE.

During 2016, LAEDC will also be producing an industry cluster report on the Trade and Logistics industry cluster of our region.