Recent trends in net oil import dependence vary by region
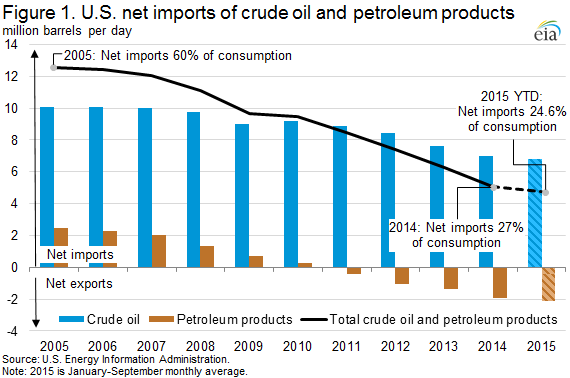
Net imports accounted for 26.5% of total petroleum and other liquid fuels consumed in the United States in 2014, the lowest percentage since 1971. Data through the first nine months of 2015 indicate a further reduction of net imports, averaging 24.6% of total consumption of petroleum and other liquid fuels. Increased U.S. crude oil production has replaced some crude oil imports, while increased refinery runs and global demand growth for petroleum products resulted in increased U.S. petroleum product exports. As a result, the United States remains a net importer of crude oil but less so, and is increasingly a net exporter of petroleum products. However, the extent to which regions of the country contribute to these changing trends varies.
U.S. net imports of total petroleum and other liquid fuels have declined by 7.5 million barrels per day (b/d) since 2005 to 5.1 million b/d in 2014. U.S. net imports of crude oil declined 3.1 million b/d between 2005 and 2014, with a further 0.2 million b/d decline for the first 9 months of 2015. The change in petroleum net imports other than crude has been even larger, with a 4.4 million b/d reduction in net imports between 2005 and 2014 (Figure 1).
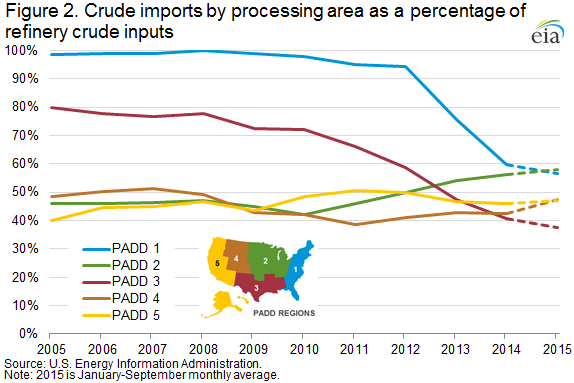
Crude oil supply patterns vary by region–some rely on imported crude oil, others mostly on domestic crude oil supply. Refineries on the East and Gulf Coasts (Petroleum Administration for Defense Districts (PADD) 1 and 3, respectively) have reduced their dependence on imported crude inputs in recent years. With very little crude oil produced in the region, refineries in PADD 1 historically imported close to 100% of the crude oil processed in the region. As crude-by-rail transport allowed increased shipments of domestic crude oil from other regions to reach East Coast refineries, imports as a percentage of refinery crude inputs fell to 60% in 2014. Data through September indicate continued declines in imports as a percentage of refinery runs to an average of 57% so far this year, but declining at a much slower rate than in 2013 and 2014 as the price difference between domestic crude oil and imported crude oil has narrowed. The Gulf Coast region is home to more than half of U.S. refining capacity, and produces the most crude oil. From 2005 to 2010, PADD 3 crude imports as a percentage of refinery crude inputs ranged from 80% to 72%. However, as domestic crude oil production increased, that percentage dropped to 41% in 2014, and has averaged 37% through September of this year.
In contrast, refineries in the Midwest (PADD 2) and the Rocky Mountains (PADD 4) have increased imports, almost entirely from Canada, as a percentage of in-region refinery crude inputs to 56% and 43%, respectively, in 2014. Data thus far in 2015 indicate that the Midwest crude imports as a percentage of refinery crude inputs may exceed the East Coast for the first time, with the Midwest averaging 58% versus the East Coast’s average of 57% (Figure 2).
Turning from crude to products, increased domestic crude oil production leading to discounted domestic crude prices, coupled with global demand growth for petroleum products, has resulted in continued high U.S. refinery runs and increased U.S. petroleum product exports. U.S. petroleum product exports have increased for 13 consecutive years, with growth in recent years coming largely from distillate and gasoline exports, and more recently with the expansion of Hydrocarbon Gas Liquids (HGL) export capacity.
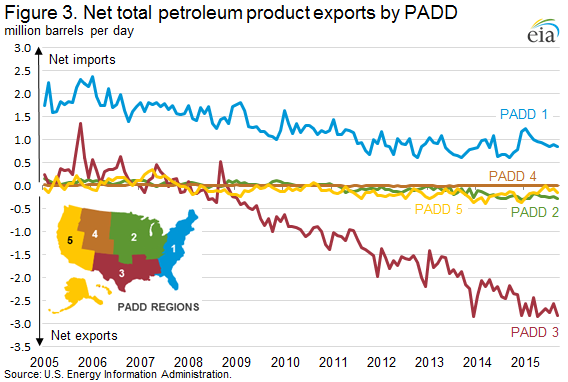
There is significant regional variation in petroleum product trade. Most petroleum product exports are from the Gulf Coast. Average PADD 3 total net petroleum product exports were 2.7 million b/d for the first nine months of 2015, in contrast to the same period of 2005 when PADD 3 was a net petroleum product importer of 280,000 b/d. Other regions have experienced far less of a dramatic shift in net import position. Average PADD 1 net imports in the first nine months of 2015 have fallen 913,000 b/d compared to the same period in 2005, helping the U.S. become a net product exporter. Data for the first nine months of 2015, which do not reflect the expected seasonal peak in gasoline exports during the final 3 months of the year, suggest that full-year 2015 U.S. net petroleum product exports will be higher than in 2014 (Figure 3).
U.S. average gasoline and diesel fuel prices both decline
The U.S. average retail price for regular gasoline decreased two cents from the previous week to $2.04 per gallon as of December 14, 2015, 52 cents per gallon less than the same time last year. Prices decreased in all regions except the Midwest, where the price increased one cent to $1.90 per gallon. The East and Gulf Coast prices both fell three cents, to $2.04 per gallon and $1.79 per gallon, respectively. The Rocky Mountain and West Coast prices both decreased two cents, to $2.00 per gallon and $2.51 per gallon, respectively.
The U.S. average price of diesel fuel decreased four cents from last week to $2.34 per gallon, $1.08 per gallon lower than the same time last year. Prices declined in all regions of the nation, with both the Midwest and West Coast prices decreasing five cents, to $2.29 per gallon and $2.55 per gallon, respectively. The East Coast price was $2.37 per gallon and the Rocky Mountain price was $2.38 per gallon, both four cents lower than last week. The Gulf Coast price was $2.21 per gallon, two cents less than last week.
Propane inventories fall
U.S. propane stocks decreased by 1.7 million barrels last week to 99.0 million barrels as of December 11, 2015, 20.6 million barrels (26.3%) higher than a year ago. Midwest inventories decreased by 0.7 million barrels while Gulf Coast and East Coast inventories both decreased by 0.4 million barrels. Rocky Mountain/West Coast inventories decreased by 0.2 million barrels. Propylene non-fuel-use inventories represented 3.2% of total propane inventories.
Residential heating oil price decreases while propane price increases
As of December 14, 2015, residential heating oil prices averaged nearly $2.26 per gallon, almost 8 cents per gallon lower than last week and nearly an 89 cent decrease from one year ago. The average wholesale heating oil price this week is $1.17 per gallon, nearly 18 cents lower than last week and just below 99 cents per gallon lower than a year ago.
Residential propane prices averaged $1.98 per gallon, 1 cent per gallon higher than last week’s price and 40 cents lower than one year ago. Wholesale propane prices averaged 46 cents per gallon, almost 4 cents per gallon lower than last week and 21 cents lower than last year’s price for the same week.
For questions about This Week in Petroleum, contact the Petroleum Markets Team www.eia.gov


