U.S. regular retail gasoline to average below $2 per gallon in 2016; lowest since 2004
The Short-Term Energy Outlook (STEO) released on February 9 forecasts that the U.S. retail regular gasoline price will average $1.98/gallon (gal) in 2016, which would be the lowest annual average since 2004, and $2.21/gal in 2017 (Figure 1). Lower crude oil prices contributed to U.S. regular gasoline retail prices declining to an average of $1.95/gal in January, down from an average of $2.04/gal in December. EIA projects regular gasoline retail prices to fall to $1.82/gal in February 2016 and average $1.88/gal in the first quarter of 2016, before rising during the spring. The diesel fuel retail price, which averaged $2.71/gal in 2015, is projected to average $2.22/gal in 2016, 7 cents/gal lower than projected in last month’s STEO, and $2.58/gal in 2017.
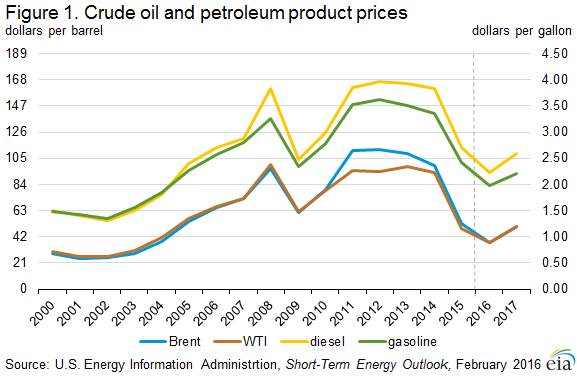
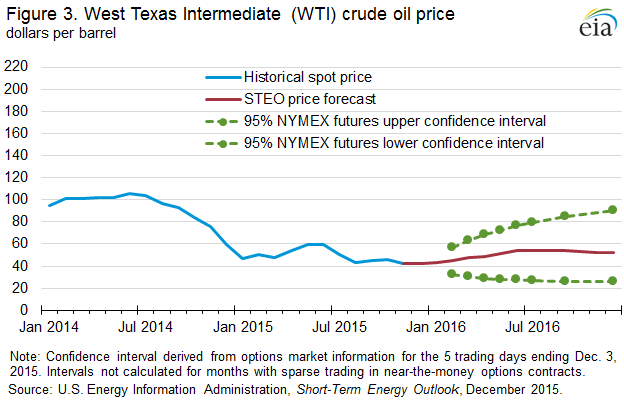
The lower outlook for petroleum product prices is based on lower expectations for crude oil prices. North Sea Brent crude oil prices are expected to average $38 per barrel (b) in 2016 and $50/b in 2017. Forecast West Texas Intermediate (WTI) crude oil prices are expected to average the same as Brent in both years. However, the current values of futures and options contracts continue to suggest high uncertainty in the price outlook (Figure 2). For example, EIA’s forecast for the average WTI price in May 2016 of $36/b should be considered in the context of recent Nymex contract values for May 2016 delivery (Market Prices and Uncertainty Report) suggesting that the market expects WTI prices to range from $21/b to $58/b (at the 95% confidence interval).
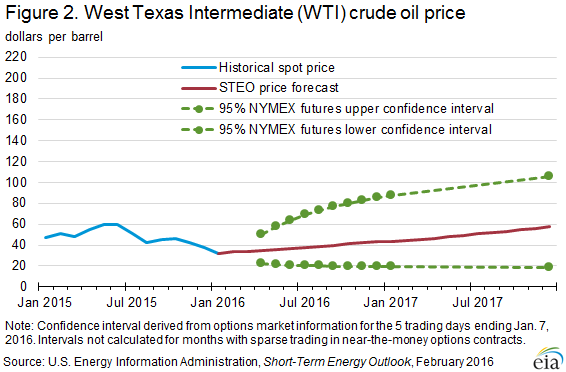
The confidence range for crude oil prices as shown in Figure 2 is derived using a variation of the Black-Scholes model that is often used by financial analysts to estimate the price of options. EIA starts with options prices for WTI crude oil, and uses the Black-Scholes model to calculate the implied volatility. WTI futures contracts and options are the among the more actively traded commodity derivative products, with many producers, consumers (including refiners, airlines, trucking companies, and fuel distributors), and other investors and risk-takers involved. The confidence interval is therefore a market-derived range that is not directly dependent on EIA’s supply and demand estimates.
Continuing increases in global liquids inventories have put significant downward pressure on oil prices since mid-2014. After growing by an estimated 1.8 million barrels per day (b/d) in 2015, global oil inventories are forecast to grow by 1.4 million b/d in the first quarter of 2016. The largest inventory builds occur in the first half of 2016, helping keep Brent prices below $40/b through August.
During January 2016, daily changes in crude oil prices were highly correlated with daily changes in global equity indexes. The increased co-movement and higher volatility likely reflect increased uncertainty about future global economic growth. Changes in overall demand for risk assets, such as commodities and equities, by investors and market participants may also be playing a larger role in price discovery across global asset markets compared with previous months.
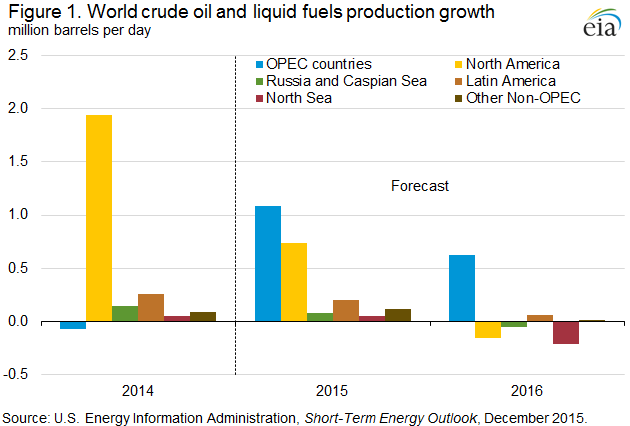
EIA estimates that petroleum and other liquid fuels production in countries outside of the Organization of the Petroleum Exporting Countries (OPEC) grew by 1.4 million b/d in 2015. The 2015 growth occurred mainly in North America. EIA expects non-OPEC production to decline by 0.6 million b/d in 2016, which would be the first decline since 2008. Most of the forecast decline in 2016 is expected to be in the United States. Non-OPEC production is forecast to decrease by 0.2 million b/d in 2017.
Changes in non-OPEC production are driven by changes in U.S. tight oil production, which is characterized by high decline rates and relatively short investment horizons, making it among the more price-sensitive globally. Forecast total U.S. liquid fuels production declines by 0.5 million b/d in 2016 and remains relatively flat in 2017.
Forecast OPEC crude oil production increases by 0.7 million b/d in 2016 and by 0.6 million b/d in 2017 with Iran accounting for most of the increase in 2017. EIA assumes that a collaborative production cut among OPEC members and other major producers does not occur in the forecast period, as major OPEC producers continue their stated strategy to maintain market share.
EIA expects global consumption of petroleum and other liquid fuels to grow by 1.2 million b/d in 2016 and by 1.5 million b/d in 2017. Forecast real gross domestic product (GDP) for the world weighted by oil consumption rises by 2.6% in 2016 and by 3.1% in 2017.
U.S. average regular gasoline and diesel fuel retail prices decrease
The U.S. average regular gasoline retail price decreased six cents from the previous week to $1.76 per gallon on February 8, down 43 cents from the same time last year. The Midwest price fell 10 cents to $1.52 per gallon. The West Coast price fell six cents to $2.31 per gallon. The Rocky Mountain price decreased five cents to $1.75 per gallon, followed by the East Coast price, which was down four cents to $1.79 per gallon. The Gulf Coast price decreased three cents to $1.56 per gallon.
The U.S. average diesel fuel price decreased two cents from the prior week to $2.01 per gallon, down 83 cents from the same time last year. The Rocky Mountain price decreased six cents per gallon to $1.91 per gallon. The West Coast price fell four cents to $2.24 per gallon. The East Coast and Gulf Coast prices each fell two cents to $2.09 per gallon and $1.90 per gallon, respectively. The Midwest price decreased one cent to $1.93 per gallon.
Propane inventories fall
U.S. propane stocks decreased by 3.3 million barrels last week to 74.8 million barrels as of February 5, 2016, 9.8 million barrels (15.2%) higher than a year ago. Gulf Coast, Midwest, and East Coast inventories dropped by 2.1 million barrels, 0.9 million barrels, and 0.3 million barrels, respectively. Rocky Mountain/West Coast inventories remained essentially unchanged, declining by only 0.01 million barrels. Propylene non-fuel-use inventories represented 4.2% of total propane inventories.
Residential heating fuel prices increase
As of February 8, 2016, residential heating oil prices averaged $2.09 per gallon, 1 cent per gallon higher than last week and 82 cents per gallon lower than last year’s price for the same week. The wholesale heating oil price this week averaged $1.13 per gallon, 2 cents per gallon less than last week and 85 cents per gallon lower than a year ago.
Residential propane prices averaged $2.03 per gallon, 1 cent per gallon higher than last week’s price and 33 cents per gallon lower than one year ago. Wholesale propane prices averaged 47 cents per gallon, 1 cent per gallon higher than last week and 20 cents per gallon lower than last year.
For questions about This Week in Petroleum, contact the Petroleum Markets Team at EIA.gov