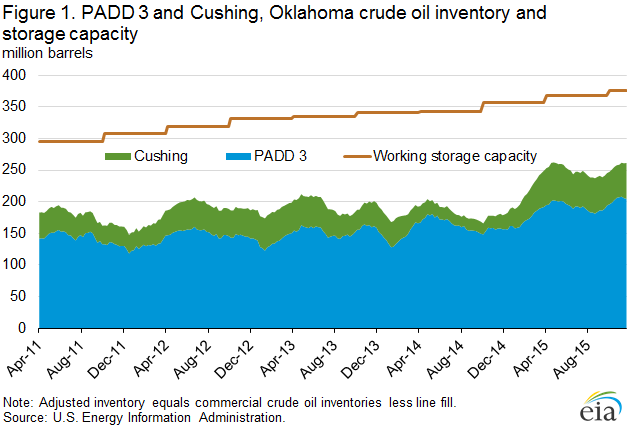
Crude oil storage capacity and inventories have increased in Cushing, Oklahoma and PADD 3 since September
Commercial crude oil inventories in Cushing, Oklahoma (located in Petroleum Administration for Defense District, or PADD, 2) and the Gulf Coast (PADD 3) totaled a record high 309.4 million barrels as of the week ending November 27 (Figure 1). Based on the recently released storage capacity and line fill data in the September Petroleum Supply Monthly (PSM), EIA estimates 70.2% utilization of working crude oil storage capacity in Cushing, Oklahoma and PADD 3 on a combined basis. This utilization level is only slightly below the record set in the week ending April 24 of this year.
While often assessed separately, looking at the combined utilization of storage capacity in Cushing and PADD 3 is currently relevant, given the increased pipeline capacity to move crude oil from Cushing to the Gulf Coast—reflected in the recently low Brent-WTI spread—during a time of high global crude oil inventory builds. Despite relatively high crude oil inventories and crude oil storage capacity utilization, there is still more than 100 million barrels of capacity available within the two areas.
For much of 2013-14, both WTI and Brent were in backwardation, meaning that near-term prices were higher than those for longer-term delivery (Figure 2). However, the backwardation in WTI prices was more pronounced and variable than for Brent prices. This difference reflected steady crude inventory declines at Cushing as a result of increasing pipeline takeaway capacity to bring crude from Cushing storage to refineries on the Gulf Coast for processing. From mid-2013 through mid-2014, Cushing inventories mostly declined and PADD 3 inventories were regularly above the historical five-year average, as crude oil movements from PADD 2 to PADD 3 increased sharply (Figure 3).
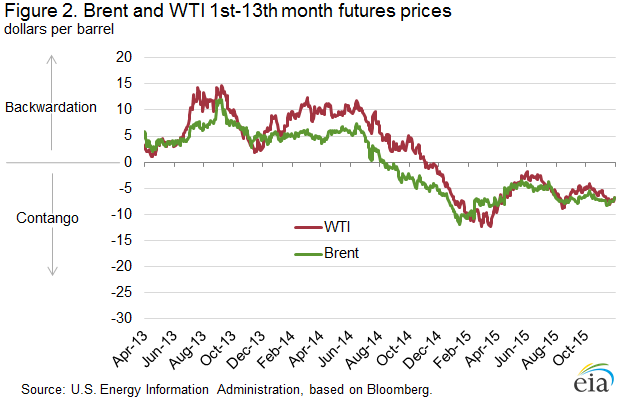
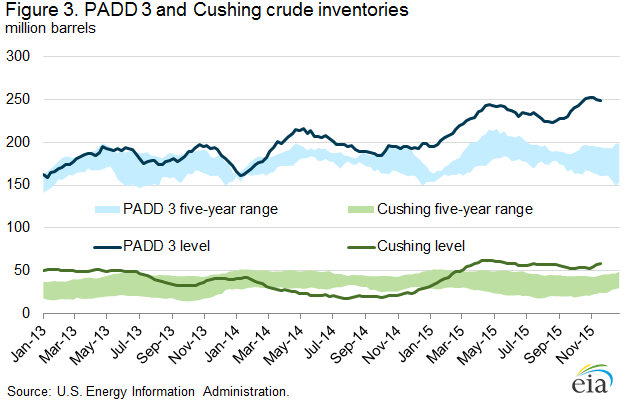
In mid-2014, as a result of global crude supply outpacing demand, the Brent price moved to contango, with current month prices lower than the thirteenth month forward price. A similar dynamic with WTI prices was slower to emerge because PADD 3 inventories were falling, and Cushing levels were very low, putting upward pressure on near-month WTI prices. WTI prices did not enter contango until the fourth quarter of 2014, following a sharp drop-off in both Brent and WTI prices. As WTI entered contango late in 2014, Cushing inventories began to increase again, and have been above the five-year range since early March. However, trade press reports that ample takeaway capacity now exists to move crude oil from Cushing to the Gulf Coast. The recent build in Cushing inventories reflects the WTI contango, and not a lack of infrastructure. Since September, the monthly average Brent-WTI spread has been about $2 per barrel.
EIA has published net available shell and working crude oil storage capacity data with the March and September PSM releases since September 2010. However, until recently, calculating an effective utilization rate for this capacity was difficult. Simply dividing EIA’s total commercial inventories by working capacity overestimated utilization because the inventory data include crude oil not stored in tanks, such as that held in pipelines (pipeline fill). As of the March 2015 release, EIA now publishes more granular data indicating estimated pipeline fill, improving the utilization calculation. Total working capacity is often the best measure of total available storage since it excludes tank bottoms and contingency space.
Crude oil working storage capacity in Cushing and PADD 3 increased by a total of 6.6 million barrels (1.8%) between March 31 and September 30 of this year. At just over 70%, total utilization remains relatively high compared with utilization rates during 2011 through 2014, which were mostly below 60% for Cushing, Oklahoma and PADD 3. Since March 2011 working crude oil storage capacity in the United States has increased by 95.6 million barrels. Most of the increase in capacity was in Cushing, Oklahoma and PADD 3, with build-outs of 25.0 million barrels and 55.7 million barrels, respectively. Combined Cushing, Oklahoma and PADD 3 accounted for about 84.5% of the increase in storage capacity since March 2011.
U.S. average gasoline and diesel fuel prices decline
The U.S. average retail regular gasoline price fell four cents from the prior week to $2.06 per gallon on November 30, 2015, down 72 cents from the same time last year. The Midwest price decreased six cents to $1.88 per gallon, while the Rocky Mountain price declined four cents to $2.05 per gallon. The Gulf Coast and West Coast prices were both down three cents, to $1.82 per gallon and $2.55 per gallon, respectively. The East Coast price decreased two cents to $2.09 per gallon.
The U.S. average diesel fuel price decreased two cents from the previous week to $2.42 per gallon, down $1.18 from the same time last year. The West Coast, Midwest, and Gulf Coast prices were each down three cents, to $2.62 per gallon, $2.41 per gallon, and $2.25 per gallon, respectively. The Rocky Mountain price declined two cents to $2.45 per gallon, and the East Coast price decreased one cent to $2.46 per gallon.
Propane inventories fall
U.S. propane stocks decreased by 2.1 million barrels last week to 104.1 million barrels as of November 27, 2015, 24.7 million barrels (31.1%) higher than a year ago. Gulf Coast inventories decreased by 1.6 million barrels and Rocky Mountain/West Coast inventories decreased by 0.3 million barrels. Midwest inventories fell by 0.2 million barrels, and East Coast inventories decreased by 0.1 million barrels. Propylene non-fuel-use inventories represented 3.0% of total propane inventories.
Residential heating oil price decreases while propane price increases
As of November 30, 2015, residential heating oil prices averaged $2.36 per gallon, nearly 2 cents per gallon below last week and almost 97 cents lower than one year ago. The average wholesale heating oil price this week was just shy of $1.43 per gallon, 1 cent higher than last week and $1.07 per gallon lower than a year ago.
Residential propane prices averaged just under $1.96 per gallon, almost 1 cent per gallon higher than last week’s price and 45 cents lower than one year ago. Wholesale propane prices averaged slightly over 50 cents per gallon, more than 1 cent per gallon higher than last week and 43 cents lower than last year’s price for the same week.