This Week In Petroleum – EIA.gov – Dec. 16, 2015

Recent trends in net oil import dependence vary by region

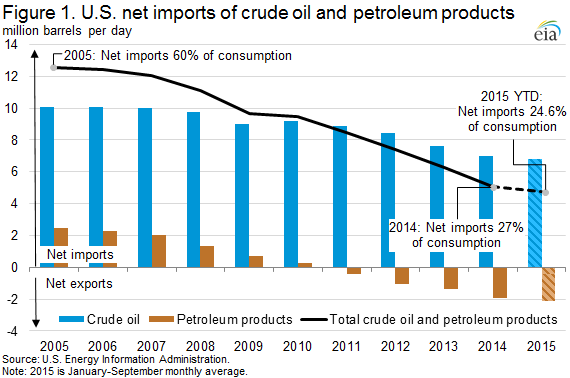
Net imports accounted for 26.5% of total petroleum and other liquid fuels consumed in the United States in 2014, the lowest percentage since 1971. Data through the first nine months of 2015 indicate a further reduction of net imports, averaging 24.6% of total consumption of petroleum and other liquid fuels. Increased U.S. crude oil production has replaced some crude oil imports, while increased refinery runs and global demand growth for petroleum products resulted in increased U.S. petroleum product exports. As a result, the United States remains a net importer of crude oil but less so, and is increasingly a net exporter of petroleum products. However, the extent to which regions of the country contribute to these changing trends varies.

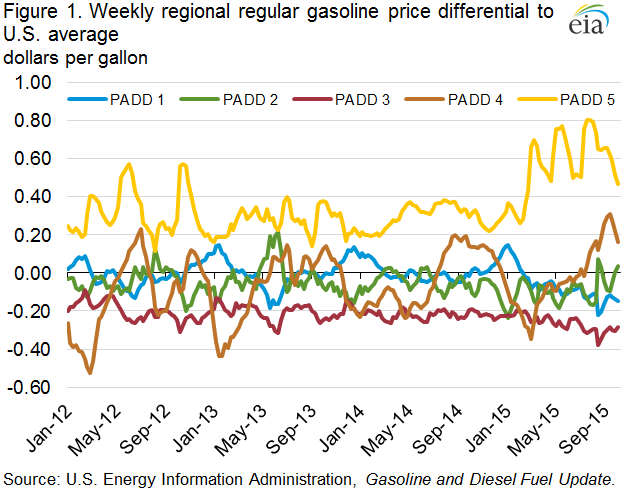
U.S. net imports of total petroleum and other liquid fuels have declined by 7.5 million barrels per day (b/d) since 2005 to 5.1 million b/d in 2014. U.S. net imports of crude oil declined 3.1 million b/d between 2005 and 2014, with a further 0.2 million b/d decline for the first 9 months of 2015. The change in petroleum net imports other than crude has been even larger, with a 4.4 million b/d reduction in net imports between 2005 and 2014 (Figure 1).

twip151216fig1-lg

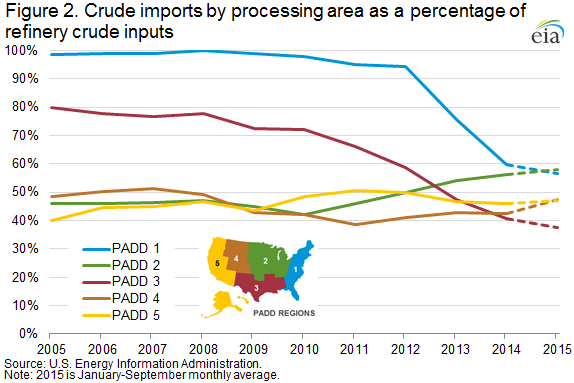
Crude oil supply patterns vary by region–some rely on imported crude oil, others mostly on domestic crude oil supply. Refineries on the East and Gulf Coasts (Petroleum Administration for Defense Districts (PADD) 1 and 3, respectively) have reduced their dependence on imported crude inputs in recent years. With very little crude oil produced in the region, refineries in PADD 1 historically imported close to 100% of the crude oil processed in the region. As crude-by-rail transport allowed increased shipments of domestic crude oil from other regions to reach East Coast refineries, imports as a percentage of refinery crude inputs fell to 60% in 2014. Data through September indicate continued declines in imports as a percentage of refinery runs to an average of 57% so far this year, but declining at a much slower rate than in 2013 and 2014 as the price difference between domestic crude oil and imported crude oil has narrowed. The Gulf Coast region is home to more than half of U.S. refining capacity, and produces the most crude oil. From 2005 to 2010, PADD 3 crude imports as a percentage of refinery crude inputs ranged from 80% to 72%. However, as domestic crude oil production increased, that percentage dropped to 41% in 2014, and has averaged 37% through September of this year.

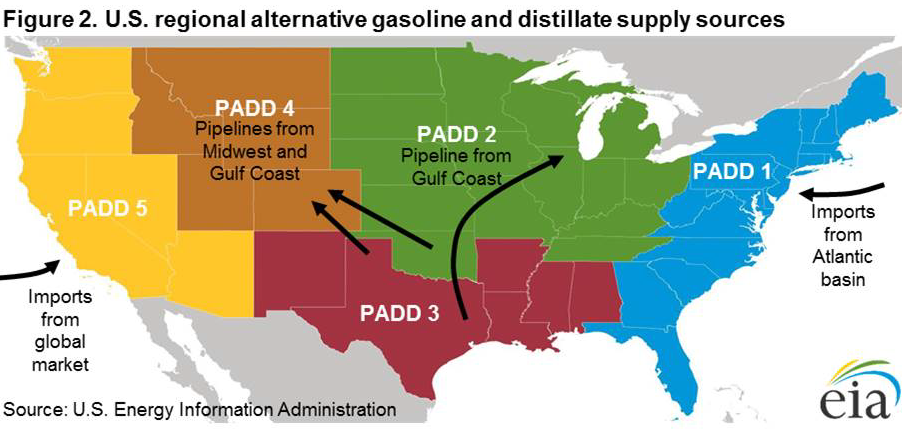
In contrast, refineries in the Midwest (PADD 2) and the Rocky Mountains (PADD 4) have increased imports, almost entirely from Canada, as a percentage of in-region refinery crude inputs to 56% and 43%, respectively, in 2014. Data thus far in 2015 indicate that the Midwest crude imports as a percentage of refinery crude inputs may exceed the East Coast for the first time, with the Midwest averaging 58% versus the East Coast’s average of 57% (Figure 2).

twip151216fig2-lg

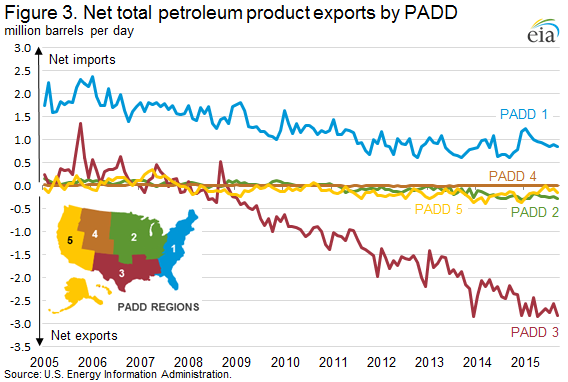
Turning from crude to products, increased domestic crude oil production leading to discounted domestic crude prices, coupled with global demand growth for petroleum products, has resulted in continued high U.S. refinery runs and increased U.S. petroleum product exports. U.S. petroleum product exports have increased for 13 consecutive years, with growth in recent years coming largely from distillate and gasoline exports, and more recently with the expansion of Hydrocarbon Gas Liquids (HGL) export capacity.

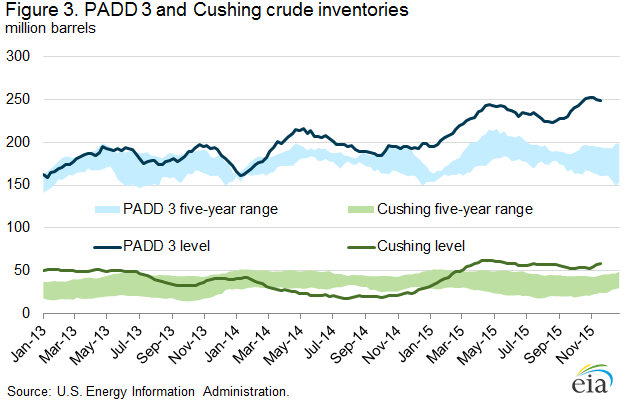
There is significant regional variation in petroleum product trade. Most petroleum product exports are from the Gulf Coast. Average PADD 3 total net petroleum product exports were 2.7 million b/d for the first nine months of 2015, in contrast to the same period of 2005 when PADD 3 was a net petroleum product importer of 280,000 b/d. Other regions have experienced far less of a dramatic shift in net import position. Average PADD 1 net imports in the first nine months of 2015 have fallen 913,000 b/d compared to the same period in 2005, helping the U.S. become a net product exporter. Data for the first nine months of 2015, which do not reflect the expected seasonal peak in gasoline exports during the final 3 months of the year, suggest that full-year 2015 U.S. net petroleum product exports will be higher than in 2014 (Figure 3).

twip151216fig3-lg

U.S. average gasoline and diesel fuel prices both decline

The U.S. average retail price for regular gasoline decreased two cents from the previous week to $2.04 per gallon as of December 14, 2015, 52 cents per gallon less than the same time last year. Prices decreased in all regions except the Midwest, where the price increased one cent to $1.90 per gallon. The East and Gulf Coast prices both fell three cents, to $2.04 per gallon and $1.79 per gallon, respectively. The Rocky Mountain and West Coast prices both decreased two cents, to $2.00 per gallon and $2.51 per gallon, respectively.

The U.S. average price of diesel fuel decreased four cents from last week to $2.34 per gallon, $1.08 per gallon lower than the same time last year. Prices declined in all regions of the nation, with both the Midwest and West Coast prices decreasing five cents, to $2.29 per gallon and $2.55 per gallon, respectively. The East Coast price was $2.37 per gallon and the Rocky Mountain price was $2.38 per gallon, both four cents lower than last week. The Gulf Coast price was $2.21 per gallon, two cents less than last week.

Propane inventories fall

U.S. propane stocks decreased by 1.7 million barrels last week to 99.0 million barrels as of December 11, 2015, 20.6 million barrels (26.3%) higher than a year ago. Midwest inventories decreased by 0.7 million barrels while Gulf Coast and East Coast inventories both decreased by 0.4 million barrels. Rocky Mountain/West Coast inventories decreased by 0.2 million barrels. Propylene non-fuel-use inventories represented 3.2% of total propane inventories.

Residential heating oil price decreases while propane price increases

As of December 14, 2015, residential heating oil prices averaged nearly $2.26 per gallon, almost 8 cents per gallon lower than last week and nearly an 89 cent decrease from one year ago. The average wholesale heating oil price this week is $1.17 per gallon, nearly 18 cents lower than last week and just below 99 cents per gallon lower than a year ago.

Residential propane prices averaged $1.98 per gallon, 1 cent per gallon higher than last week’s price and 40 cents lower than one year ago. Wholesale propane prices averaged 46 cents per gallon, almost 4 cents per gallon lower than last week and 21 cents lower than last year’s price for the same week.

For questions about This Week in Petroleum, contact the Petroleum Markets Team www.eia.gov 


This Week In Petroleum – EIA.gov – Dec. 9, 2015

December Short-Term Energy Outlook forecasts non-OPEC production decline in 2016

The Short-Term Energy Outlook (STEO) released on December 8 forecasts non-OPEC crude oil and other liquids production to grow by 1.2 million barrels per day (b/d) in 2015, and then decline by 0.4 million b/d in 2016, which would be the first annual decline in non-OPEC production since 2008. The shift in expectation from non-OPEC production growth to declines in 2016 is mostly because of declines in U.S. onshore and North Sea production (Figure 1). Non-OPEC production growth in 2015 is largely attributable to investments committed to projects before the oil price decline that began in mid-2014. Redirection of investment away from exploration towards currently producing fields has also helped maintain or increase production levels in other non-OPEC countries. This strategy has helped maintain production levels in the short term, but it will likely result in lower future production in areas that depend on continued exploration successes for output growth.

twip151209fig1-lg

According to the latest survey-based reporting of monthly crude oil production estimates, U.S. production averaged 9.4 million b/d through the first nine months of 2015. This level is 0.1 million b/d higher than the average production during the fourth quarter of 2014, despite a more than 60% decline in the total U.S. oil-directed rig count since October 2014. However, monthly crude oil production started to decrease in the second quarter of 2015. Lower 48 onshore output began declining in April 2015, and has fallen from 7.6 million b/d in March to an estimated 7.1 million b/d in November. Total U.S. crude oil production began declining in May 2015, and has fallen from 9.6 million b/d in April to an estimated 9.2 million b/d in November.

EIA expects U.S. crude oil production declines to continue through September 2016, when total production is forecast to average 8.5 million b/d. This level of production would be 1.1 million b/d less than the 2015 peak reached in April. Forecast production begins increasing in late 2016, returning to an average of 8.7 million b/d in the fourth quarter. Expected crude oil production declines through September 2016 are largely attributable to unattractive economic returns in some areas of both emerging and mature onshore oil production regions, as well as seasonal factors such as anticipated hurricane-related production disruptions in the Gulf of Mexico. Reductions in 2015 cash flows and capital expenditures have prompted companies to defer or redirect investment away from marginal exploration and research drilling to focus on core areas of major tight oil plays.

EIA forecasts OPEC crude oil and other liquids production to increase by 1.1 million b/d in 2015, led by production increases in Iraq. Forecast OPEC crude oil and other liquids production increases by 0.6 million b/d in 2016, with Iran expected to increase production once international sanctions targeting its oil sector are suspended. At its December 4 meeting, OPEC members announced they “should continue to closely monitor developments in the coming months.” This indicates OPEC producers, led by Saudi Arabia, are continuing the policy of defending market share in a low oil price environment.

EIA expects global consumption of petroleum and other liquids to grow by 1.4 million b/d in both 2015 and 2016. Projected real gross domestic product (GDP) for the world weighted by oil consumption, which increased by 2.7% in 2014, is expected to rise by 2.3% in 2015 and by 2.6% in 2016. Despite continuing demand growth and slowing supply growth, global petroleum and other liquids production continues to outpace consumption, leading to inventory expansion throughout the forecast period (Figure 2).

twip151209fig2-lg

Global oil inventory builds in the third quarter of 2015 averaged 1.8 million b/d, down from 2.0 million b/d in the second quarter, which had the highest level of inventory builds since the fourth quarter of 2008. The pace of inventory builds is expected to slow in the fourth quarter to roughly 1.4 million b/d. In 2016, inventory builds are expected to slow further to an average of 0.6 million b/d.

The current average price forecast for Brent crude oil in 2016 is associated with a further reduction in the outlook for supply growth that in turn reduces the surplus of supply over consumption. EIA estimates average North Sea Brent crude oil prices of $53/barrel (b) in 2015 and $56/b in 2016. The 2015 price forecast is $1/b lower than in last month’s forecast and the 2016 estimate is unchanged. Forecast West Texas Intermediate (WTI) crude oil prices average $4/b lower than the Brent price in 2015 and $5/b lower in 2016. Current values of futures and options contracts continue to suggest high uncertainty in the price outlook (Market Prices and Uncertainty Report). Based on contracts traded during the five-day period ending December 3, the lower and upper limits of the 95% confidence interval for the market’s expectation of monthly average WTI prices are estimated at $30/b and $63/b for March 2016, widening to $26/b and $90/b for December 2016 (Figure 3). Key market uncertainties include the pace and volume at which Iranian oil reenters the market, the strength of oil consumption growth, and the responsiveness of non-OPEC production to low oil prices.

twip151209fig3-lg

U.S. average gasoline and diesel fuel prices both decline

The U.S. average retail price for regular gasoline decreased one cent from the previous week to $2.05 per gallon as of December 7, 2015, 63 cents per gallon less than the same time last year. Prices decreased in all regions except the Midwest, where the price increased one cent to $1.89 per gallon. The Rocky Mountain price fell four cents to $2.01 per gallon. Both the East Coast and West Coast prices dropped more than one cent, to $2.07 per gallon and $2.54 per gallon, respectively. The Gulf Coast price was $1.82 per gallon, declining less than one cent from last week.

The U.S. average price of diesel fuel decreased four cents from last week to $2.38 per gallon, $1.16 per gallon lower than the same time last year. Prices declined in all regions, with the largest decrease occurring in the Midwest, where the price dropped six cents to $2.35 per gallon. The East Coast and Rocky Mountain prices both decreased four cents, to $2.41 per gallon in each region. The Gulf Coast and West Coast prices both fell two cents, to $2.23 per gallon and $2.60 per gallon, respectively.

Propane inventories fall

U.S. propane stocks decreased by 3.4 million barrels last week to 100.7 million barrels as of December 4, 2015, 21.5 million barrels (27.2%) higher than a year ago. Gulf Coast inventories decreased by 2.4 million barrels and Midwest inventories decreased by 0.7 million barrels. East Coast inventories decreased by 0.3 million barrels while Rocky Mountain/West Coast inventories remained unchanged. Propylene non-fuel-use inventories represented 2.9% of total propane inventories.

Residential heating oil price decreases while propane price increases

As of December 7, 2015, residential heating oil prices averaged $2.33 per gallon, 3 cents per gallon below last week and 89 cents lower than one year ago. The average wholesale heating oil price this week is $1.35 per gallon, nearly 8 cents lower than last week and 91 cents per gallon lower than a year ago.

Residential propane prices averaged just under $1.97 per gallon, almost 1 cent per gallon higher than last week’s price and nearly 42 cents lower than one year ago. Wholesale propane prices averaged just shy of 50 cents per gallon, almost 1 cent per gallon lower than last week and nearly 25 cents lower than last year’s price for the same week.

For questions about This Week in Petroleum, contact the Petroleum Markets Team at www.eia.gov


This Week In Petroleum – EIA.gov – Dec. 2, 2015

Crude oil storage capacity and inventories have increased in Cushing, Oklahoma and PADD 3 since September

Commercial crude oil inventories in Cushing, Oklahoma (located in Petroleum Administration for Defense District, or PADD, 2) and the Gulf Coast (PADD 3) totaled a record high 309.4 million barrels as of the week ending November 27 (Figure 1). Based on the recently released storage capacity and line fill data in the September Petroleum Supply Monthly (PSM), EIA estimates 70.2% utilization of working crude oil storage capacity in Cushing, Oklahoma and PADD 3 on a combined basis. This utilization level is only slightly below the record set in the week ending April 24 of this year.

While often assessed separately, looking at the combined utilization of storage capacity in Cushing and PADD 3 is currently relevant, given the increased pipeline capacity to move crude oil from Cushing to the Gulf Coast—reflected in the recently low Brent-WTI spread—during a time of high global crude oil inventory builds. Despite relatively high crude oil inventories and crude oil storage capacity utilization, there is still more than 100 million barrels of capacity available within the two areas.

twip151202fig1-lg


For much of 2013-14, both WTI and Brent were in backwardation, meaning that near-term prices were higher than those for longer-term delivery (Figure 2). However, the backwardation in WTI prices was more pronounced and variable than for Brent prices. This difference reflected steady crude inventory declines at Cushing as a result of increasing pipeline takeaway capacity to bring crude from Cushing storage to refineries on the Gulf Coast for processing. From mid-2013 through mid-2014, Cushing inventories mostly declined and PADD 3 inventories were regularly above the historical five-year average, as crude oil movements from PADD 2 to PADD 3 increased sharply (Figure 3).


twip151202fig2-lg

twip151202fig3-lg

In mid-2014, as a result of global crude supply outpacing demand, the Brent price moved to contango, with current month prices lower than the thirteenth month forward price. A similar dynamic with WTI prices was slower to emerge because PADD 3 inventories were falling, and Cushing levels were very low, putting upward pressure on near-month WTI prices. WTI prices did not enter contango until the fourth quarter of 2014, following a sharp drop-off in both Brent and WTI prices. As WTI entered contango late in 2014, Cushing inventories began to increase again, and have been above the five-year range since early March. However, trade press reports that ample takeaway capacity now exists to move crude oil from Cushing to the Gulf Coast. The recent build in Cushing inventories reflects the WTI contango, and not a lack of infrastructure. Since September, the monthly average Brent-WTI spread has been about $2 per barrel.

EIA has published net available shell and working crude oil storage capacity data with the March and September PSM releases since September 2010. However, until recently, calculating an effective utilization rate for this capacity was difficult. Simply dividing EIA’s total commercial inventories by working capacity overestimated utilization because the inventory data include crude oil not stored in tanks, such as that held in pipelines (pipeline fill). As of the March 2015 release, EIA now publishes more granular data indicating estimated pipeline fill, improving the utilization calculation. Total working capacity is often the best measure of total available storage since it excludes tank bottoms and contingency space.

Crude oil working storage capacity in Cushing and PADD 3 increased by a total of 6.6 million barrels (1.8%) between March 31 and September 30 of this year. At just over 70%, total utilization remains relatively high compared with utilization rates during 2011 through 2014, which were mostly below 60% for Cushing, Oklahoma and PADD 3. Since March 2011 working crude oil storage capacity in the United States has increased by 95.6 million barrels. Most of the increase in capacity was in Cushing, Oklahoma and PADD 3, with build-outs of 25.0 million barrels and 55.7 million barrels, respectively. Combined Cushing, Oklahoma and PADD 3 accounted for about 84.5% of the increase in storage capacity since March 2011.

U.S. average gasoline and diesel fuel prices decline

The U.S. average retail regular gasoline price fell four cents from the prior week to $2.06 per gallon on November 30, 2015, down 72 cents from the same time last year. The Midwest price decreased six cents to $1.88 per gallon, while the Rocky Mountain price declined four cents to $2.05 per gallon. The Gulf Coast and West Coast prices were both down three cents, to $1.82 per gallon and $2.55 per gallon, respectively. The East Coast price decreased two cents to $2.09 per gallon.

The U.S. average diesel fuel price decreased two cents from the previous week to $2.42 per gallon, down $1.18 from the same time last year. The West Coast, Midwest, and Gulf Coast prices were each down three cents, to $2.62 per gallon, $2.41 per gallon, and $2.25 per gallon, respectively. The Rocky Mountain price declined two cents to $2.45 per gallon, and the East Coast price decreased one cent to $2.46 per gallon.

Propane inventories fall

U.S. propane stocks decreased by 2.1 million barrels last week to 104.1 million barrels as of November 27, 2015, 24.7 million barrels (31.1%) higher than a year ago. Gulf Coast inventories decreased by 1.6 million barrels and Rocky Mountain/West Coast inventories decreased by 0.3 million barrels. Midwest inventories fell by 0.2 million barrels, and East Coast inventories decreased by 0.1 million barrels. Propylene non-fuel-use inventories represented 3.0% of total propane inventories.

Residential heating oil price decreases while propane price increases

As of November 30, 2015, residential heating oil prices averaged $2.36 per gallon, nearly 2 cents per gallon below last week and almost 97 cents lower than one year ago. The average wholesale heating oil price this week was just shy of $1.43 per gallon, 1 cent higher than last week and $1.07 per gallon lower than a year ago.

Residential propane prices averaged just under $1.96 per gallon, almost 1 cent per gallon higher than last week’s price and 45 cents lower than one year ago. Wholesale propane prices averaged slightly over 50 cents per gallon, more than 1 cent per gallon higher than last week and 43 cents lower than last year’s price for the same week.

For questions about This Week in Petroleum, contact the Petroleum Markets Team at www.eia.gov

This Week In Petroleum – EIA.gov – Oct. 21, 2015

Fourth-quarter 2015 refinery outage report released
EIA has issued a report on expected fourth-quarter refinery outages and their potential implications for the availability of gasoline and distillate supply at the Petroleum Administration for Defense District (PADD) and sub-PADD levels. This report analyzes the availability of refinery capacity to produce diesel fuel and heating oil (distillate) and gasoline, focusing on two refinery units, the atmospheric crude distillation unit (ACDU) and the fluid catalytic cracking unit (FCCU), which are strongly correlated with distillate and gasoline production, respectively. In addition, data for planned maintenance on catalytic reforming units (CRU) and hydrocracking units (HU) are provided. The report also contains a discussion of current market conditions and average historical unplanned outages.

Refinery outages result from the planned shutdown of refinery units for maintenance and upgrades, and from unplanned shutdowns from a variety of causes such as mechanical failure, bad weather, power failures, fire, and flooding. Planned maintenance is typically scheduled when refined petroleum product consumption is relatively low.

Across the different regions of the country, fourth-quarter 2015 planned refinery maintenance is concentrated in October, and many refineries have returned to or are in the process of returning to normal operations. Less maintenance is planned for November and minimal maintenance is planned for December. Table 1 provides a by-PADD, by-month summary of the percentage of available refining capacity expected to be out of service for maintenance during October through December.

Oct-21-tables-eia.gov
Source: U.S. Energy Information Administration, based on Industrial Info Resources data as of September 1, 2015.

In most regions, fourth-quarter planned maintenance is light compared to last year as well as to historical levels. However, in the Midwest, 13% of ACDU capacity is expected to be offline for maintenance in October. After generally staying above the five-year range for much of 2015, PADD 2 ACDU gross inputs fell off sharply in early October. For the week ending October 9, the rolling four-week average for PADD 2 gross inputs was 209,000 barrels per day (b/d) lower than the five-year average. Despite the decrease in gross inputs, distillate inventories remain above the five-year average for this time of year and gasoline inventories are similar to where they were last year. While Midwest refineries supply most of the distillate fuel and gasoline that is consumed in the region, the Midwest also receives products from the Gulf Coast, including supplemental supply during disruptions.

PADD 5 (West Coast) planned ACDU maintenance is minimal over the period, but planned FCCU maintenance in October and November is more than 50,000 b/d higher than the 10-year average and more than 25,000 b/d higher than the 10-year maximum. The ongoing unplanned FCCU outage following the February 18 explosion at the ExxonMobil refinery in Torrance, California, has continued to put upward pressure on gasoline prices in the region. Imports of total motor gasoline to California ranged between 28,000 b/d and 68,000 b/d in March through July, compared with an average of 5,000 b/d in 2013-14. Further outages, either planned or unplanned, would exacerbate the supply situation. PADD 5 gasoline inventories declined steadily during the summer driving season, reaching a multiyear low of 25.7 million barrels on August 21. Since then, gasoline inventories have rebuilt and have been above the five-year average since September 11. Distillate inventories have been above the five-year average for much of the year.

U.S. average retail gasoline and diesel fuel prices decrease
The U.S. average retail price for regular gasoline declined six cents from last week to $2.28 per gallon on October 19, down 84 cents per gallon from the same time last year. The Midwest price fell 11 cents to $2.30 per gallon, followed by the Rocky Mountain price, which was down seven cents to $2.36 per gallon. The West Coast and Gulf Coast prices each fell five cents, to $2.70 per gallon and $2.00 per gallon, respectively. The East Coast price decreased three cents to $2.17 per gallon.

The U.S. average diesel fuel price decreased three cents from the previous week to $2.53 per gallon, down $1.13 per gallon from the same point last year. The Rocky Mountain price posted the lone price increase, up less than one cent to remain $2.52 per gallon. The Midwest, East Coast, and West Coast prices each decreased three cents, to $2.60 per gallon, $2.52 per gallon, and $2.70 per gallon, respectively. The Gulf Coast price was down one cent to $2.33 per gallon.

Propane inventories fall

U.S. propane stocks decreased by 0.6 million barrels last week to 101.6 million barrels as of October 16, 2015, 20.0 million barrels (24.5%) higher than a year ago. Gulf Coast inventories decreased by 0.5 million barrels and Midwest inventories decreased by 0.3 million barrels. Rocky Mountain/West Coast inventories increased by 0.1 million barrels while East Coast inventories remained unchanged. Propylene non-fuel-use inventories represented 4.4% of total propane inventories.

Residential heating oil price decreases while propane remains unchanged
As of October 19, 2015, residential heating oil prices averaged nearly $2.43 per gallon, 1 cent per gallon lower than last week and $1.05 lower than one year ago. The average wholesale heating oil price this week is $1.60 per gallon, 10 cents less than last week and $1.05 per gallon less than a year ago during the same week of the 2014-2015 heating season.

Residential propane prices averaged $1.90 per gallon, less than 1 cent per gallon higher than last week’s price and 49 cents lower than one year ago. Wholesale propane prices averaged 54 cents per gallon, 4 cents per gallon lower than last week’s price and 53 cents lower than the price on October 20, 2014.

For questions about This Week in Petroleum, contact the Petroleum Markets Team at EIA.gov

This Week In Petroleum – EIA.gov – Oct. 15, 2015

Effects of unplanned refinery outages on prices vary by region

Unplanned refinery outages can have noticeable effects on liquid fuel markets, disrupting supplies of gasoline and distillate. In late August, unplanned outages occurred at two refineries on the East Coast, Petroleum Administration for Defense District (PADD) 1, affecting a significant portion of PADD 1 gasoline production capacity. However, unlike similar incidents on the West Coast (PADD 5) and in the Midwest (PADD 2), there was no significant movement in gasoline prices as a result of the outages. How a region is supplied, what alternative supply options exist, and the costs and lead times for those options will largely determine to what extent prices react to unplanned outages (Figure 1).

twip151015fig1-lg


While refineries make arrangements for alternative sources of supply during periods of planned maintenance to ensure that obligations are met, it sometimes takes days or weeks for markets to adjust to the sudden loss of production when an unexpected outage occurs. As a result, unplanned refinery outages often result in a reduction in supply that causes prices to increase, sometimes dramatically. The severity and duration of these price spikes depend on how quickly the refinery problem can be resolved and how soon supply from alternative sources can reach the affected market.

All five PADDs have two immediate sources of alternative supply: inventories and production from other in-region refineries. However, should these sources prove insufficient, the next option for alternative supplies is somewhat different for each region (Figure 2).

maptwip151015fig2-lg

The West Coast is isolated from other U.S. markets and located far from international sources of supply, so the region is dependent on in-region production to meet demand. Mainland PADD 5 has three distinct supply/demand centers (Pacific Northwest, Northern California, and Southern California), separated from each other by a lack of north-south pipelines within the PADD and from other U.S. markets by mountains to the east. In the event of a major unplanned refinery outage — such as the one that occurred atExxonMobil’s refinery in Torrance, California in February — inventories and production from unaffected refineries in the immediate area are insufficient to meet demand. Limited pipeline connectivity between market centers and neighboring regions, as well as the more stringent product specifications for California, mean that the only remaining alternative resupply option for PADD 5 is imports.

Since the Torrance outage, imported supplies of gasoline have been arriving in Southern California from all over the world at an average rate of 27,000 — 68,000 barrels per day (b/d) for March through July (latest state-specific data available). This compares with an average of 5,000 b/d in 2013-14. Total motor gasoline imports into PADD 5 as a whole were 79,000 b/d for the week ending October 9. The distance required for these imports requires long lead time and higher prices.

The Rocky Mountain (PADD 4) region is another relatively isolated regional market, but one that still has access via pipelines to refineries in the Gulf Coast and the southern half of PADD 2. Additionally, demand in the Rocky Mountains is small compared to other U.S. markets. Together, these factors allow the Rocky Mountain region to rely on in-region refinery production and receipts from other regions in the event of an unplanned outage.

The Midwest is a large region consisting of multiple semiconnected markets, but without access to international markets via marine movements. PADD 2 refineries produce significant amounts of gasoline and the region has increasingly become dependent on in-region production, but the region still requires additional supplies from the Gulf Coast (PADD 3) to meet demand. In the event of a major unplanned outage, such as the August partial shutdown of the BP refinery in Whiting, Indiana, alternative supply comes from the Gulf Coast via several large product pipeline systems. Although this resupply option requires less time than acquiring supplies from the international market, it does require higher prices in the affected market versus the Gulf Coast to attract supplies, as happened in the summer of 2013 and in early August of this year.

The Gulf Coast is home to half of U.S. refining capacity and produces far more gasoline and distillate than the region consumes. Therefore, unplanned refinery outages in PADD 3 rarely have a large effect on wholesale and retail prices.

Gasoline demand on the East Coast far exceeds in-region refinery production. Additional supplies from the Gulf Coast arrive via pipeline and ship, but given existing infrastructure and regulations, are not entirely sufficient to meet demand. Therefore, the East Coast also imports gasoline, mostly from relatively close-by refineries in Europe and eastern Canada (Figure 2). In the event of major unplanned refinery outages — like those that occurred at PBF’s refinery in Delaware City, Delaware and the Phillips 66 refinery in Bayway, New Jersey, in late August — the East Coast’s alternative supply option is imports. Because gasoline cargoes are actively traded in the Atlantic Basin, and the distances involved are not as great as on the West Coast, East Coast prices tend to rise more modestly following refinery outages compared with those on the West Coast.


twip151015fig3-lg

EIA will soon release its Refinery Outages: Fourth-Quarter 2015 report, with data on planned refinery maintenance for the remainder of this year.

U.S. average gasoline and diesel fuel prices increase

The U.S. average regular gasoline retail price increased two cents from the previous week to $2.34 per gallon on October 12, 2015, 87 cents per gallon lower than at the same time last year. The Rocky Mountain and West Coast prices both decreased, by five cents and four cents respectively, to $2.42 per gallon and $2.75 per gallon, respectively. The Midwest price increased five cents to $2.41 per gallon. The East Coast and Gulf Coast prices both increased two cents, to $2.19 per gallon and $2.05 per gallon, respectively.

The U.S. average diesel fuel price increased six cents from last week to $2.56 per gallon, down $1.14 per gallon from the same time last year. The Midwest price increased 15 cents to $2.63 per gallon, supported by widespread refinery maintenance and harvest demand. The West Coast price increased four cents to $2.73 per gallon, while the East Coast price was up three cents to $2.55 per gallon. The Gulf Coast and Rocky Mountain prices each increased two cents, to $2.34 per gallon and $2.52 per gallon, respectively.

Propane inventories gain

U.S. propane stocks increased by 1.8 million barrels last week to 102.2 million barrels as of October 9, 2015, 20.8 million barrels (25.5%) higher than a year ago. Midwest inventories increased by 0.7 million barrels while Gulf Coast and East Coast inventories both increased by 0.6 million barrels. Rocky Mountain/West Coast inventories decreased by 0.1 million barrels. Propylene non-fuel-use inventories represented 4.3% of total propane inventories.

Residential heating oil price increases while propane price decreases

As of October 12, 2015, residential heating oil prices averaged $2.44 per gallon, 2 cents per gallon higher than last week and $1.08 lower than one year ago. The average wholesale heating oil price this week is $1.70 per gallon, nearly 7 cents more than last week and 97 cents per gallon less than a year ago during the same week of the 2014-2015 heating season. Residential propane prices averaged $1.91 per gallon, nearly 7 cents per gallon lower than last week’s price and 46 cents lower than one year ago. Wholesale propane prices averaged nearly 59 cents per gallon, almost 3 cents per gallon higher than last week’s price and 53 cents lower than the price on October 13, 2014.

For questions about This Week in Petroleum, contact the EIA.gov Petroleum Markets Team


EIA – Weekly Petroleum Data for the Week Ending October 9, 2015

U.S. crude oil refinery inputs averaged about 15.3 million barrels per day during the week ending October 9, 2015, 292,000 barrels per day less than the previous week’s average. Refineries operated at 86.0% of their operable capacity last week. Gasoline production increased last week, averaging over 9.6 million barrels per day. Distillate fuel production decreased last week, averaging over 4.6 million barrels per day.

U.S. crude oil imports averaged over 7.3 million barrels per day last week, up by 247,000 barrels per day from the previous week. Over the last four weeks, crude oil imports averaged 7.3 million barrels per day, 1.7% below the same four-week period last year. Total motor gasoline imports (including both finished gasoline and gasoline blending components) last week averaged 719,000 barrels per day.

Distillate fuel imports averaged 130,000 barrels per day last week. U.S. commercial crude oil inventories (excluding those in the Strategic Petroleum Reserve) increased by 7.6 million barrels from the previous week. At 468.6 million barrels, U.S. crude oil inventories remain near levels not seen for this time of year in at least the last 80 years. Total motor gasoline inventories decreased by 2.6 million barrels last week, but are above the upper limit of the average range. Finished gasoline inventories increased while blending components inventories decreased last week. Distillate fuel inventories decreased by 1.5 million barrels last week but are in the middle of the average range for this time of year. Propane/propylene inventories rose 1.8 million barrels last week and are well above the upper limit of the average range. Total commercial petroleum inventories increased by 3.3 million barrels last week.

Total products supplied over the last four-week period averaged over 19.5 million barrels per day, up by 1.2% from the same period last year. Over the last four weeks, motor gasoline product supplied averaged 9.1 million barrels per day, up by 3.4% from the same period last year. Distillate fuel product supplied averaged 4.0 million barrels per day over the last four weeks, up by 5.4% from the same period last year. Jet fuel product supplied is up 5.5% compared to the same four-week period last year.

EIA – Weekly Petroleum Data for Week of September 18, 2015

Oil-Pumps-for-EIA

Summary of Weekly Petroleum Data for the Week Ending September 18, 2015

U.S. crude oil refinery inputs averaged 16.2 million barrels per day during the week ending September 18, 2015, 310,000 barrels per day less than the previous week’s average. Refineries operated at 90.9% of their operable capacity last week. Gasoline production increased last week, averaging over 9.5 million barrels per day. Distillate fuel production increased slightly last week, averaging 5.1 million barrels per day.

U.S. crude oil imports averaged 7.2 million barrels per day last week, down by 13,000 barrels per day from the previous week. Over the last four weeks, crude oil imports averaged over 7.4 million barrels per day, 2.0% below the same four-week period last year. Total motor gasoline imports (including both finished gasoline and gasoline blending components) last week averaged 504,000 barrels per day. Distillate fuel imports averaged 164,000 barrels per day last week. U.S. commercial crude oil inventories (excluding those in the Strategic Petroleum Reserve) decreased by 1.9 million barrels from the previous week. At 454.0 million barrels, U.S. crude oil inventories remain near levels not seen for this time of year in at least the last 80 years. Total motor gasoline inventories increased by 1.4 million barrels last week, and are in the upper half of the average range. Finished gasoline inventories stayed same while blending components inventories increased last week. Distillate fuel inventories decreased by 2.1 million barrels last week but are in the middle of the average range for this time of year. Propane/propylene inventories fell 0.6 million barrels last week but are well above the upper limit of the average range. Total commercial petroleum inventories decreased by 2.9 million barrels last week.

Total products supplied over the last four-week period averaged 19.7 million barrels per day, up by 1.6% from the same period last year. Over the last four weeks, motor gasoline product supplied averaged about 9.2 million barrels per day, up by 3.0% from the same period last year. Distillate fuel product supplied averaged 3.8 million barrels per day over the last four weeks, up by 1.3% from the same period last year. Jet fuel product supplied is up 5.7% compared to the same four-week period last year.