Carbon tax: Not what Robin Hood had in mind

There is often some fairly muddled logic spouted by those who work in the corridors of power on Capitol Hill, but even by Washington’s standards this one takes the cake: Rep. Jared Polis (D-CO) referring to a carbon tax as a “tax cut.”

As E&E Daily reported recently, in response to the House taking up a resolution opposing a carbon tax, Rep. Polis said “this is the first sign of momentum for a carbon tax cut — and you’ll hear me referring to it as a carbon tax cut because that’s essentially what it is: using carbon tax revenues to cut taxes for the American people.” By his logic, the carbon tax is like Robin Hood: robbing from the rich, giving to the poor.

Except that’s not quite true. To begin, the notion that raising taxes and then giving it back is somehow a tax cut is the sort of fuzzy thinking that could only take place in Washington, DC.

Second, does anybody really believe that 100 percent of this tax will be given back to the people? And finally, even if it is given back, it is highly likely that it will go to the government’s preferred group of consumers – the kind of affluent consumer that can afford to install solar panels and drive around in expensive (and subsidized) electric vehicles.

Rep. Polis can keep referring to a carbon tax as a “tax cut,” but repeating the same fallacy over and over again does not somehow make it true.

About The AuthorAFPM Communications provides insights from inside AFPM. To learn more about AFPM, visit AFPM.org.

This email address is being protected from spambots. You need JavaScript enabled to view it.

New Research Makes Divestment Folly Even Harder To Ignore

Further research from Arizona State University has been released today which highlights – yet again – just how damaging divestment will be for universities that bow to pressure from narrow-minded pressure groups, and shed their investments in fossil fuel companies.

Findings from Dr. Hendrik Bessembinder, a professor at ASU’s Carey School of Business, show that costs related to divestment have the potential to rob endowment funds of as much as 12 percent of their total value over a 20-year time frame. For large institutions, this could be as much as $7.4 billion, while medium-sized institutions could see a reduction of between $52 million and $298 million. For small institutions, the loss could stretch from $17 million to $89 million.

But the costs with divestment don’t stop at the loss of funds. Dr. Bessembinder’s findings show that heavy transaction and compliance costs will be incurred as fund managers sell off their fossil fuel holdings, as many of these are held in mutual funds, commingled funds and private equity funds. Substantial research and compliance costs will also be incurred as managers ensure their investments comply with their divestment goals.

Finally, the report also adds that the top 10 environmentally-focused funds charge management fees 10 basis points higher than their peers in the active management space, and 38 basis points higher than the passively-managed funds that long-term investors tend to favor.

As stark as these numbers are, they become even more grave when viewed in context. A 12 percent drop in endowment funds means a 12 percent drop in funds for the college. In turn, this means less money for research, fellowships, financial aid and professorships – among much, much more.

Although some reports state that the divestment movement has been “largely rebuffed,” pressure on campuses across the country to shed their fossil fuel investments still remains. However, while the divestment advocates claim to represent the best interests of American citizens, divestment merely politicizes energy production in favor of more expensive methods – harming the very people advocates think they are trying to save.

About The AuthorAFPM Communications provides insights from inside AFPM. To learn more about AFPM, visit AFPM.org.


First new U.S. nuclear reactor in almost two decades set to begin operating

photo of Watts Bar nuclear generating station, as explained in the article text

Source: Republished with permission from the Tennessee Valley Authority


The Tennessee Valley Authority’s (TVA) Watts Bar Unit 2 was connected to the power grid on June 3, becoming the first nuclear power plant to come online since 1996, when Watts Bar Unit 1 started operations. Watts Bar Unit 2 is undergoing final testing, producing electricity at incremental levels of power, as TVA prepares to start commercial operation later this summer. The new reactor is designed to add 1,150 megawatts (MW) of electricity generating capacity to southeastern Tennessee.

Watts Bar Unit 2 is the first nuclear plant in the United States to meet new regulations from the U.S. Nuclear Regulatory Commission (NRC) that were established after the 2011 earthquake and tsunami that damaged the Fukushima Daiichi Nuclear Plant in Japan. After the NRC issued an operating license for the unit in October 2015, 193 new fuel assemblies were loaded into the reactor vessel the following month. TVA announced at the end of May that the reactor achieved its first sustained nuclear fission reaction.

Construction on Watts Bar Unit 2 originally began in 1973, but construction was halted in 1985 after the NRC identified weaknesses in TVA’s nuclear program. In August 2007, the TVA board of directors authorized the completion of Watts Bar Unit 2, and construction started in October 2007. At that time, a study found Unit 2 to be effectively 60% complete with $1.7 billion invested. The study said the plant could be finished in five years at an additional cost of $2.5 billion. However, both the timeline and cost estimate developed in 2007 proved to be overly optimistic, as construction was not completed until 2015, and costs ultimately totaled $4.7 billion.

graph of U.S. nuclear reactors that began construction and came online since 1973, as explained in the article text


Although Watts Bar 2 is the first new U.S. nuclear generator to come online in 20 years, four other reactors are currently under construction and are expected to join the nuclear fleet within the next four years. Vogtle Electric Generating Plant Units 3 and 4 in Georgia and Virgil C. Summer Nuclear Generating Station Units 2 and 3 in South Carolina are scheduled to become operational in 2019–20, adding 4,540 MW of generation capacity.

Principal contributors: Sara Hoff, Marta Gospodarczyk

Total U.S. electricity sales projected to grow slowly as electricity intensity declines

June 15, 2016graph of electricity sales by sector, as explained in the article text


Electricity sales, as projected in the U.S. Energy Information Administration’s most recent Annual Energy Outlook (AEO2016) Reference case, increase in each sector through 2040. In 2015, 3.7 trillion kilowatthours (kWh) of electricity were sold, and total electricity sales are projected to rise 0.7% annually through the projection period. The residential sector currently purchases the most electricity, with a 38% share of total electricity sales in 2015. However, sales in the commercial sector are projected to surpass those in the residential sector in the early 2020s.

The AEO2016 Reference case, which reflects current laws and regulations, includes the U.S. Environmental Protection Agency’s Clean Power Plan (CPP). The CPP allows state regulators to encourage customers to purchase specified energy-efficient technologies as a part of state compliance strategies. The AEO2016 Reference case assumes that consumers will receive subsidies of 10% or 15% between 2020 and 2025 for certain energy efficient appliances, equipment, and building envelope improvements.

graph of residential, commercial, and industrial energy intensity, as explained in the article text


The residential sector currently is the largest electricity-consuming sector, with 1.4 trillion kWh sold in 2015. Electricity sales in the residential sector are projected to grow by 0.3% per year in the Reference case from 2015 through 2040 as the number of households increases by 0.8% per year. Residential energy intensity is expected to decline, with the average purchased electricity per household falling 11.3% from 2015 to 2040. Federal efficiency standards for most major end uses, including lighting, space cooling and heating, and water heating, as well as state and local building energy codes, are the main reasons for the electricity intensity decline.

Electricity sales to commercial consumers are projected to increase at an average annual rate of 0.8% from 2015 to 2040. Commercial sector electricity intensity (electricity sales per square foot of floorspace) is projected to decline 0.3% per year as total commercial sector floorspace increases 1.1% per year. Federal energy efficiency standards, as well as technological improvements in lighting, refrigeration, space heating, and space cooling, contribute to the decline in electricity intensity.

Electricity sales to industrial consumers are projected to rise 1.1% per year on average, from 1.0 trillion kWh in 2015 to 1.2 trillion kWh in 2040. With the value of industrial shipments projected to grow 1.9% per year in the Reference case, industrial sector electricity intensity, or electricity sales per dollar of industrial shipments, declines at an average annual rate of 0.8% from 2015 to 2040. The decline in projected electricity intensity results from the adoption of more energy-efficient technologies and structural changes in the economy toward less electricity-intensive industries.

A recent extension of federal tax credits for residential and commercial solar photovoltaic (PV) systems, combined with the expected continuation of declining PV prices, spurs increased adoption of residential and commercial PV in the AEO2016 Reference case projection. Total building PV capacity grows at 8.6% annually in the AEO2016 Reference case. Generation from residential PV systems reaches 90 billion kWh, and commercial system generation reaches 36 billion kWh by 2040. Residential and commercial electricity sales would be 5.0% and 1.7% higher, respectively, in 2040 without the electricity generated by rooftop PV systems.

Principal contributor: Kimberly Klaiman

Baker Hughes Rig Count App

Need a quick way to get an accurate view of active Oil, Gas, or Thermal drilling rigs on your mobile device? Well we’ve have some good news!

Baker Hughes, one of the top oilfield service companies in the world, has put together a pretty slick Rig Count app for Apple’s iOS mobile platform. (It isn’t yet available for Android but I imagine it is coming soon).

App-BH-Logo

The active rig data is a big part of the economic indicators in our petroleum and energy sectors. A stable rig count in very general terms can show that the petroleum industry is fairly healthy, while a dropping rig count can indicate some sort of market turmoil occurring or about to take place. Of course the inverse is true as well, a quickly increasing number of drilling rigs can help to highlight a spike in prices as well as herald a new boom in the energy sectors.

In many ways it goes well beyond just the price of petroleum and natural gas, in fact Baker Hughes explains it succinctly on their website…

Rig Counts are an important business barometer for the drilling industry and its suppliers. The active rig count acts as a leading indicator of demand for products used in drilling, completing, producing and processing hydrocarbons” – Baker Hughes Website

Take a second to truly picture the amount of economic activity that goes into petroleum production, not just on producer side, but on the support side as well…engineering, manufacturing, construction, transportation, trade, consumer goods, along with almost every part of the global economy.

rig-app-overview rig-app-regional-custom rig-app-map rig-app-map-close-up

The Baker Hughes Rig Count App does exactly says it will, namely give you the Active Drilling Rig Count for the U.S., Canada, and international territories.

At first opening the app you will see the full U.S. Rig Count, the number of changes (+/-) that have occurred since the last data update (usually done on the last business day of each week), and the rolling count comparing the current number of rigs vs the number that were active at that time last year. At the default setting the app will also show the same data for Canada and International areas.

You can customize the App’s homepage by selecting more specific regions like U.S. States or in some cases particular oil production basins. This will add your section to the homepage and will even include some more specific data, like the type of rigs operating in the region (oil, gas, thermal), the type of drilling tech they are using (horizontal, vertical, directional), and the depth of the drills (less-than-10K, 10K-15K, greater-than-15K).

Using the Map tab will give you the full google-map interface with a layer of drilling rig data. You can easily zoom in and out to get a smaller scale view of your region of interest with easy to follow interactive icons. Simply tap the rig you want and it pulls up a quick list of information including: What they are drilling for, the trajectory of the drill, the depth, the basin they are operating in, the state, the county, whether it is a land or water based rig, and what sort of the well type it is (development or established).

Like we said it covers a lot of bases…particularly if you are looking for a smooth, interactive interface that will let you quickly reference data and locations of the current active rigs.

Make sure to download the app from the App Store

This Week In Petroleum – EIA.gov – Feb. 10, 2016

U.S. regular retail gasoline to average below $2 per gallon in 2016; lowest since 2004

The Short-Term Energy Outlook (STEO) released on February 9 forecasts that the U.S. retail regular gasoline price will average $1.98/gallon (gal) in 2016, which would be the lowest annual average since 2004, and $2.21/gal in 2017 (Figure 1). Lower crude oil prices contributed to U.S. regular gasoline retail prices declining to an average of $1.95/gal in January, down from an average of $2.04/gal in December. EIA projects regular gasoline retail prices to fall to $1.82/gal in February 2016 and average $1.88/gal in the first quarter of 2016, before rising during the spring. The diesel fuel retail price, which averaged $2.71/gal in 2015, is projected to average $2.22/gal in 2016, 7 cents/gal lower than projected in last month’s STEO, and $2.58/gal in 2017.

twip160210fig1-lg

The lower outlook for petroleum product prices is based on lower expectations for crude oil prices. North Sea Brent crude oil prices are expected to average $38 per barrel (b) in 2016 and $50/b in 2017. Forecast West Texas Intermediate (WTI) crude oil prices are expected to average the same as Brent in both years. However, the current values of futures and options contracts continue to suggest high uncertainty in the price outlook (Figure 2). For example, EIA’s forecast for the average WTI price in May 2016 of $36/b should be considered in the context of recent Nymex contract values for May 2016 delivery (Market Prices and Uncertainty Report) suggesting that the market expects WTI prices to range from $21/b to $58/b (at the 95% confidence interval).

twip160210fig2-lg

The confidence range for crude oil prices as shown in Figure 2 is derived using a variation of the Black-Scholes model that is often used by financial analysts to estimate the price of options. EIA starts with options prices for WTI crude oil, and uses the Black-Scholes model to calculate the implied volatility. WTI futures contracts and options are the among the more actively traded commodity derivative products, with many producers, consumers (including refiners, airlines, trucking companies, and fuel distributors), and other investors and risk-takers involved. The confidence interval is therefore a market-derived range that is not directly dependent on EIA’s supply and demand estimates.

Continuing increases in global liquids inventories have put significant downward pressure on oil prices since mid-2014. After growing by an estimated 1.8 million barrels per day (b/d) in 2015, global oil inventories are forecast to grow by 1.4 million b/d in the first quarter of 2016. The largest inventory builds occur in the first half of 2016, helping keep Brent prices below $40/b through August.

During January 2016, daily changes in crude oil prices were highly correlated with daily changes in global equity indexes. The increased co-movement and higher volatility likely reflect increased uncertainty about future global economic growth. Changes in overall demand for risk assets, such as commodities and equities, by investors and market participants may also be playing a larger role in price discovery across global asset markets compared with previous months.

EIA estimates that petroleum and other liquid fuels production in countries outside of the Organization of the Petroleum Exporting Countries (OPEC) grew by 1.4 million b/d in 2015. The 2015 growth occurred mainly in North America. EIA expects non-OPEC production to decline by 0.6 million b/d in 2016, which would be the first decline since 2008. Most of the forecast decline in 2016 is expected to be in the United States. Non-OPEC production is forecast to decrease by 0.2 million b/d in 2017.

Changes in non-OPEC production are driven by changes in U.S. tight oil production, which is characterized by high decline rates and relatively short investment horizons, making it among the more price-sensitive globally. Forecast total U.S. liquid fuels production declines by 0.5 million b/d in 2016 and remains relatively flat in 2017.

Forecast OPEC crude oil production increases by 0.7 million b/d in 2016 and by 0.6 million b/d in 2017 with Iran accounting for most of the increase in 2017. EIA assumes that a collaborative production cut among OPEC members and other major producers does not occur in the forecast period, as major OPEC producers continue their stated strategy to maintain market share.

EIA expects global consumption of petroleum and other liquid fuels to grow by 1.2 million b/d in 2016 and by 1.5 million b/d in 2017. Forecast real gross domestic product (GDP) for the world weighted by oil consumption rises by 2.6% in 2016 and by 3.1% in 2017.

U.S. average regular gasoline and diesel fuel retail prices decrease

The U.S. average regular gasoline retail price decreased six cents from the previous week to $1.76 per gallon on February 8, down 43 cents from the same time last year. The Midwest price fell 10 cents to $1.52 per gallon. The West Coast price fell six cents to $2.31 per gallon. The Rocky Mountain price decreased five cents to $1.75 per gallon, followed by the East Coast price, which was down four cents to $1.79 per gallon. The Gulf Coast price decreased three cents to $1.56 per gallon.

The U.S. average diesel fuel price decreased two cents from the prior week to $2.01 per gallon, down 83 cents from the same time last year. The Rocky Mountain price decreased six cents per gallon to $1.91 per gallon. The West Coast price fell four cents to $2.24 per gallon. The East Coast and Gulf Coast prices each fell two cents to $2.09 per gallon and $1.90 per gallon, respectively. The Midwest price decreased one cent to $1.93 per gallon.

Propane inventories fall

U.S. propane stocks decreased by 3.3 million barrels last week to 74.8 million barrels as of February 5, 2016, 9.8 million barrels (15.2%) higher than a year ago. Gulf Coast, Midwest, and East Coast inventories dropped by 2.1 million barrels, 0.9 million barrels, and 0.3 million barrels, respectively. Rocky Mountain/West Coast inventories remained essentially unchanged, declining by only 0.01 million barrels. Propylene non-fuel-use inventories represented 4.2% of total propane inventories.

Residential heating fuel prices increase

As of February 8, 2016, residential heating oil prices averaged $2.09 per gallon, 1 cent per gallon higher than last week and 82 cents per gallon lower than last year’s price for the same week. The wholesale heating oil price this week averaged $1.13 per gallon, 2 cents per gallon less than last week and 85 cents per gallon lower than a year ago.

Residential propane prices averaged $2.03 per gallon, 1 cent per gallon higher than last week’s price and 33 cents per gallon lower than one year ago. Wholesale propane prices averaged 47 cents per gallon, 1 cent per gallon higher than last week and 20 cents per gallon lower than last year.

For questions about This Week in Petroleum, contact the Petroleum Markets Team at EIA.gov

This Week In Petroleum – EIA.gov – Feb. 3, 2016

East Coast, Gulf Coast trade transportation fuels to balance needs, supply

With just over half of total U.S. refining capacity, the Gulf Coast (Petroleum Administration for Defense District, or PADD, 3) is the largest domestic supplier of transportation fuels. Regional consumption is less than one-third of in-region production. The East Coast (PADD 1) is the largest transportation fuels consuming region in the country. However, that region’s limited refinery capacity produces transportation fuels to meet just one-fifth of regional consumption. Pipeline infrastructure linking the two PADDs and international trade play key roles in balancing the mismatch between the supply and use of transportation fuels within each region (Figure 1).

On February 3, the U.S. Energy Information Administration (EIA) released aPADD 1 and 3 Transportation Fuels Markets study, which examines transportation fuels (motor gasoline, distillate fuel, and jet fuel) supply, consumption, and distribution at both the PADD level and for specific areas within the PADDs.

maptwip160203fig1-lg

The East Coast region includes states from Maine to Florida along the U.S. Atlantic Coast. The Gulf Coast region comprises states between New Mexico in the west to Alabama in the east, primarily along the Gulf of Mexico. For this study, transportation fuels include gasoline, distillate fuel (including diesel), and jet fuel. Residual fuel oil supply is also analyzed where applicable.

The study considers the East Coast as four distinct regions: New England (PADD 1A), Central Atlantic (PADD 1B), the Southeast, and Florida. The Gulf Coast is divided into five regions: New Mexico, Texas Inland, Texas Gulf Coast, Louisiana Gulf Coast, and North Louisiana-Arkansas (Figure 2).

maptwip160203fig2-lg


The study examines transportation fuels supply, consumption, and distribution patterns within the specific sub-PADD regions. The study evaluates the supply, storage, and distribution of transportation fuels from in-region refineries and other domestic sources of supply as well as imports. The study characterizes the infrastructure associated with the distribution of transportation fuels including infrastructure associated with refineries, bulk terminals, pipelines, marine movements, as well as transportation fuel distribution patterns. The study also considers regional supply/demand balances and includes a discussion of the wholesale and retail market structure for each region.

This study is the second in a series by EIA to inform its analyses of petroleum product markets, especially during periods of supply disruptions and market change. A previously published study analyzed PADD 5 (West Coast) transportation fuels markets. Planned studies will analyze PADD 5 crude supply and the transportation fuels markets in the Midwest (PADD 2) and Rocky Mountains (PADD 4).

U.S. average retail regular gasoline and diesel fuel prices decrease

The U.S. average retail price for regular gasoline decreased three cents from the previous week to $1.82 per gallon on February 1, 2016, down 25 cents from the same time last year. The West Coast price decreased eight cents to $2.38 per gallon, followed by the Rocky Mountain price, which decreased six cents to $1.80 per gallon. The Gulf Coast price was down four cents to $1.59 per gallon. The East Coast price decreased three cents to $1.84 per gallon, and the Midwest price was down one cent to $1.62 per gallon.

The U.S. average diesel fuel price decreased four cents from last week to $2.03 per gallon, down 80 cents per gallon from the same time last year. The West Coast, Rocky Mountain, and Midwest prices each fell five cents to $2.27 per gallon, $1.97 per gallon, and $1.94 per gallon, respectively. The Gulf Coast price was down four cents to $1.92 per gallon. The East Coast price decreased three cents to $2.11 per gallon.

Propane inventories fall

U.S. propane stocks decreased by 5.6 million barrels last week to 78.1 million barrels as of January 29, 2016, 10.8 million barrels (16.1%) higher than a year ago. Gulf Coast inventories decreased by 3.1 million barrels, Midwest inventories fell by 1.3 million barrels, and East Coast and Rocky Mountain/West Coast inventories each declined by 0.6 million barrels. Propylene non-fuel-use inventories represented 4.1% of total propane inventories.

Residential heating fuel prices increase

As of February 1, 2016, residential heating oil prices averaged $2.08 per gallon, nearly 2 cents per gallon higher than last week and almost 72 cents lower than last year’s price for the same week. The wholesale heating oil price this week averaged $1.14 per gallon, almost 8 cents higher than last week and nearly 69 cents per gallon lower than a year ago.

Residential propane prices averaged $2.02 per gallon, less than a penny per gallon higher than last week’s price and almost 35 cents lower than one year ago. Wholesale propane prices averaged 46 cents per gallon, just over 2 cents per gallon higher than last week and almost 15 cents per gallon lower than last year.

For questions about This Week in Petroleum, contact the Petroleum Markets Team at EIA.gov

This Week In Petroleum – EIA.gov – Jan. 27, 2016

Warm temperatures and low oil prices are reducing home heating expenditures

A combination of warmer-than-expected temperatures and lower-than-expected oil prices have contributed to a reduction in forecast average heating expenditures this winter (October-March) compared with EIA’s forecast in the October 2015 Winter Fuels Outlook. Each October, EIA produces a Winter Fuels Outlook that projects heating fuel expenditures for the coming winter (October through March) based on EIA’s forecast of fuel prices and the National Oceanic and Atmospheric Administration’s (NOAA) forecast for temperatures (as measured by heating degree days). As discussed in the October 2015 Winter Fuels Outlook, the winter of 2015–16 was expected to have lower expenditures than the winter of 2014–15. In the time since that outlook was released, the weather has been much warmer than expected and prices have fallen faster than anticipated, resulting in even lower heating expenditures as forecast in the January Short-Term Energy Outlook (STEO).

Petroleum-based heating fuels, such as heating oil and propane, are used mainly in the eastern part of the United States. Heating oil use is concentrated in the Northeast, and significant amounts of propane are used in both the Northeast and Midwest. According to the January STEO, these areas of the country are expected to be roughly 20% warmer than last winter (Figure 1). At the beginning of the winter, the Northeast and Midwest were expected to be 13% and 11% warmer than last winter, respectively. However, January is typically the coldest month of the winter, and if January turns out to be significantly colder than forecast, averages for the whole winter will move closer to normal.

twip160127fig1-lg

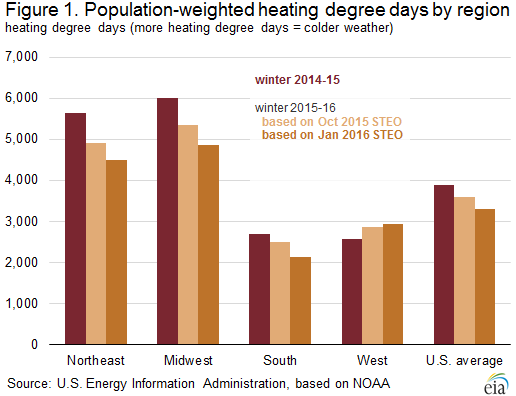
At the national level, as of NOAA’s December forecast, the 2015–16 winter is expected to be 15% warmer than last winter, as the warm temperatures east of the Rocky Mountains are partially offset by temperatures in the West that are both slightly colder than previously forecasted and colder than last year’s relatively warm winter.

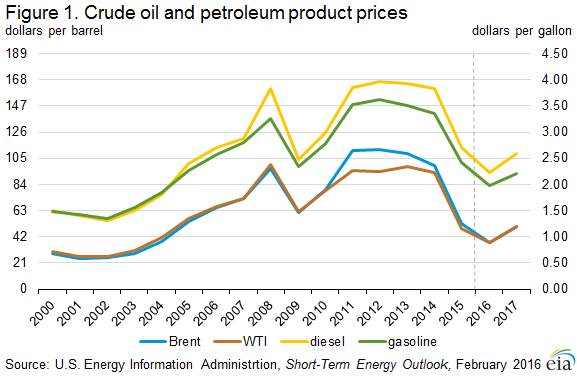
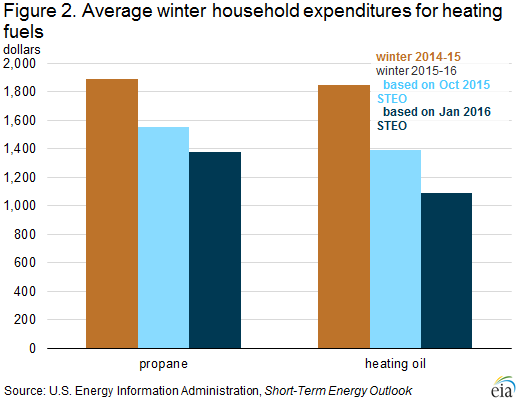
In addition to the warm weather, falling crude oil prices and ample supplies of distillate fuel have contributed to lower retail fuel prices than forecast in October. Heating oil prices in particular have been weak, with the average winter 2015–16 retail price now expected to be $2.17/gallon (gal), down from a forecast of $2.57/gal in October. Last winter, retail heating oil prices averaged $3.04/gal. As a result, the average household that heats primarily with heating oil is forecast to spend $760 (41%) less on fuel this winter than last winter (Figure 2).

twip160127fig2-lg

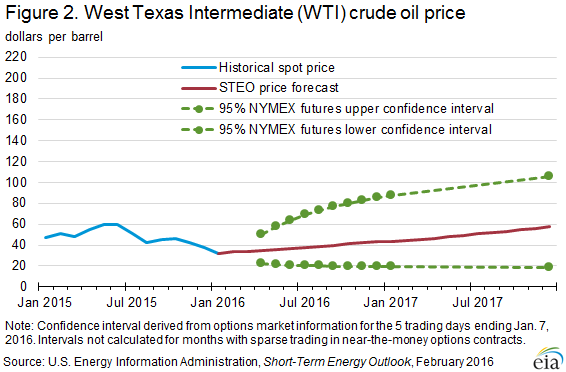
Brent crude oil prices are the main driver of retail heating oil prices, and Brent prices fell from a monthly average of $48 per barrel (b) in October to an average of $31/b through the first 20 days of January. That $17/b price decline is equivalent to about 40 cents/gal. EIA did not foresee this drop in price in the October outlook. Crude oil prices fell sharply in recent months, as OPEC producers (at their December 4 meeting) indicated plans to continue the policy of defending market share in a low oil price environment and as global oil inventories continued to build, with the monthly average Brent spot price in December reaching its lowest level since mid-2004.

Strong supply and weak demand globally for distillate fuel (a fuel category that includes products such as diesel and heating oil) have reduced refining margins for distillate, further contributing to low heating oil prices. EIA estimates that the refining margin for heating oil in January is about 28 cents/gal, the lowest margin in January since 2011. Slowing economic growth in emerging economies and a relatively warm winter have reduced growth in global demand for distillate fuel. Additionally, strong gasoline refining margins for this time of year have encouraged high global refinery runs. This combination of high refinery runs and slowing demand growth has resulted in high inventory levels in major distillate markets including Asia, northwest Europe, and the northeast United States. For the week ending January 15, distillate fuel inventories in the northeast United States were 51.8 million barrels, 55% higher than the five-year (2011-15) average.

Retail propane prices have also been lower than was forecast in the October STEO. In the January STEO, EIA forecast winter 2015-16 propane prices to average $2.73/gal in the Northeast and $1.56/gal in the Midwest, down 12 cents/gal and 10 cents/gal, respectively, from the projections at the beginning of winter. These prices are also lower than last winter. Propane prices did not fall as rapidly as heating oil prices this winter because propane prices are partially tied to natural gas prices, which have declined but by less than oil prices. The link to natural gas prices occurs because a significant amount of propane is produced at natural gas processing plants and because propane competes in the petrochemical feedstock market with other hydrocarbon gas liquids produced at natural gas processing plants, such as ethane. In the January STEO, EIA forecasts that households that heat primarily with propane will, on average, see heating expenditures fall by $540 (24%) in the Northeast and by $480 (31%) in the Midwest compared with last winter.

U.S. average regular gasoline and diesel fuel retail prices decrease

The U.S. average regular gasoline retail price fell six cents from the previous week to $1.86 per gallon on January 25, 2016, 19 cents lower than the same time last year. The Midwest price was down eight cents to $1.63 per gallon. The West Coast price decreased six cents to $2.46 per gallon. The Rocky Mountain price decreased five cents to $1.86 per gallon. The Gulf Coast and East Coast prices each decreased four cents to $1.63 per gallon and $1.87 per gallon, respectively.

The U.S. average diesel fuel price decreased four cents to $2.07 per gallon, down 80 cents from the same time last year. The Rocky Mountain and Gulf Coast prices each fell six cents per gallon to $2.02 per gallon and $1.96 per gallon, respectively. The Midwest price was down four cents to $1.99 per gallon. The West Coast and East Coast prices decreased three cents to $2.33 per gallon and $2.14 per gallon, respectively.

Propane inventories fall

U.S. propane stocks decreased by 6.2 million barrels last week to 83.7 million barrels as of January 22, 2016, 14.4 million barrels (20.8%) higher than a year ago. Gulf Coast and Midwest inventories dropped by 4.0 million barrels and 1.7 million barrels, respectively, while East Coast inventories fell by 0.4 million barrels and Rocky Mountain/West Coast inventories declined by 0.1 million barrels. Propylene non-fuel-use inventories represented 3.9% of total propane inventories.

Residential heating oil price decreases; propane price increases

As of January 25, 2016, residential heating oil prices averaged $2.06 per gallon, 5 cents per gallon lower than last week and 75 cents lower than one year ago. The wholesale heating oil price this week averaged $1.07 per gallon, 7 cents higher than last week and 69 cents per gallon lower than a year ago.

Residential propane prices averaged $2.02 per gallon, less than 1 cent per gallon higher than last week’s price and 35 cents lower than one year ago. Wholesale propane prices averaged 44 cents per gallon, 3 cents per gallon higher than last week and 19 cents lower than last year’s price for the same week.

For questions about This Week in Petroleum, contact the Petroleum Markets Team at EIA.gov

This Week In Petroleum – EIA.gov – Jan. 13, 2016

Crude oil prices will remain relatively low through 2016 and 2017

The Short-Term Energy Outlook (STEO) released on January 12 forecasts that Brent crude oil prices will average $40 per barrel (b) in 2016 and $50/b in 2017. This is the first STEO to include forecasts for 2017. Forecast West Texas Intermediate (WTI) crude oil prices average $2/b lower than Brent in 2016 and $3/b lower in 2017. However, the current values of futures and options contracts continue to suggest high uncertainty in the price outlook (Figure 1). For example, EIA’s forecast for the average WTI price in April 2016 of $37/b should be considered in the context of recent contract values for April 2016 delivery (Market Prices and Uncertainty Report), suggesting that the market expects WTI prices to range from $25/b to $56/b (at the 95% confidence interval).

The confidence range for crude oil prices as shown in Figure 1 is derived using a variation of the Black-Scholes that is often used by financial analysts to estimate the price of options. EIA starts with options prices for WTI crude oil, and uses the Black-Scholes model to calculate the implied volatility. WTI futures contracts and options are the among the most actively traded commodity derivative products, with many producers, consumers (including refiners, airlines, trucking companies, and fuel distributors), and other investors and risk-takers involved. The confidence interval is thus a market-derived range that is not directly dependent on EIA’s supply and demand estimates.

Continuing increases in global liquids inventories have put significant downward pressure on oil prices since mid-2014. EIA estimates that global oil inventories increased by 1.9 million b/d in 2015, marking the second consecutive year of inventory builds. This oversupply has contributed to oil prices falling to the lowest monthly average since mid-2004. Inventories are forecast to rise by an additional 0.7 million b/d in 2016, before the global oil market becomes relatively balanced in 2017 (Figure 2). The first draw on global oil inventories in 15 consecutive quarters is expected in the third quarter of 2017.

EIA estimates that petroleum and other liquid fuels production in countries outside of the Organization of the Petroleum Exporting Countries (OPEC) grew by 1.3 million b/d in 2015. The 2015 growth occurred mainly in North America. EIA expects non-OPEC production to decline by 0.6 million b/d in 2016, which would be the first decline since 2008. Most of the forecast decline in 2016 is expected to be in the United States. Non-OPEC production is forecast to decrease by an additional 0.1 million b/d in 2017.

Changes in non-OPEC production are driven by changes in U.S. tight oil production, which is characterized by high decline rates and relatively short investment horizons that make it among the more price-sensitive crude production globally. Forecast total U.S. liquid fuels production declines by 0.4 million b/d in 2016 and remains relatively flat in 2017.

Forecast OPEC crude oil production increases by 0.5 million b/d in 2016, with Iran expected to increase production once international sanctions targeting its oil sector are suspended. Although uncertainty remains as to the timing of sanctions relief, EIA assumes the implementation occurs in the first quarter of 2016, clearing the way to ease sanctions at that time. EIA has moved up the anticipated implementation day because Iran has made faster-than-expected progress in meeting key obligations required under the Joint Comprehensive Plan of Action.

Iran’s crude oil production is forecast to grow by about 0.3 million b/d in 2016 and by 0.5 million b/d in 2017. The growth of Iran’s crude oil production through the forecast period also depends on internal factors, including Iran’s ability to mitigate production decline rates and meet technical challenges, and on its willingness to discount the price of oil.

At OPEC’s December 4 meeting, members voted to reactivate Indonesia’s OPEC membership after an almost seven-year hiatus. EIA therefore includes Indonesia’s crude oil and other liquids production in the OPEC total for both history and the forecast.

EIA expects global consumption of petroleum and other liquid fuels to grow by 1.4 million b/d in both 2016 and 2017. Forecast real gross domestic product (GDP) for the world weighted by oil consumption, which increased by an estimated 2.4% in 2015, rises by 2.7% in 2016 and by 3.2% in 2017.

U.S. average retail regular gasoline price below $2.00 per gallon for the first time since 2009; diesel fuel prices decrease

The U.S. average retail price for regular gasoline fell three cents from the previous week to $1.996 per gallon on January 11, 2016, 14 cents lower than the same time last year and the first time since March 2009 that the U.S. average was below $2.00 per gallon. The Midwest price fell four cents to $1.82 per gallon. The West Coast and East Coast prices each decreased three cents to $2.63 per gallon and $1.97 per gallon, respectively. The Gulf Coast and Rocky Mountain prices both decreased two cents to $1.73 per gallon and $1.95 per gallon, respectively.

The U.S. average diesel fuel price decreased three cents from the prior week to $2.18 per gallon, 88 cents lower than the same time last year. The Rocky Mountain price was down six cents to $2.13 per gallon. The West Coast price decreased four cents to $2.43 per gallon. The East Coast, Midwest, and Gulf Coast prices all decreased three cents to $2.23 per gallon, $2.10 per gallon, and $2.08 per gallon, respectively.

Propane inventories fall

U.S. propane stocks decreased by 4.5 million barrels last week to 91.9 million barrels as of January 8, 2016, 17.0 million barrels (22.7%) higher than a year ago. Gulf Coast inventories decreased by 2.9 million barrels and Midwest inventories decreased by 1.2 million barrels. East Coast and Rocky Mountain/West Coast inventories each decreased comparatively modestly, falling by 0.3 million barrels and 0.1 million barrels, respectively. Propylene non-fuel-use inventories represented 3.4% of total propane inventories.

Residential heating oil price decreases while propane price increases

As of January 11, 2016, residential heating oil prices averaged $2.16 per gallon, almost 2 cents per gallon lower than last week and nearly 75 cents lower than one year ago. The average wholesale heating oil price this week is $1.09 per gallon, 9 cents lower than last week and almost 70 cents per gallon lower than a year ago.

Residential propane prices averaged $2.01 per gallon, 1 cent per gallon higher than last week’s price and nearly 34 cents lower than one year ago. Wholesale propane prices averaged just over 43 cents per gallon, 2 cents per gallon lower than last week and nearly 14 cents lower than last year’s price for the same week.

For questions about This Week in Petroleum, contact the Petroleum Markets Team at www.EIA.gov.

This Week In Petroleum – EIA.gov – Dec. 16, 2015

Recent trends in net oil import dependence vary by region

Net imports accounted for 26.5% of total petroleum and other liquid fuels consumed in the United States in 2014, the lowest percentage since 1971. Data through the first nine months of 2015 indicate a further reduction of net imports, averaging 24.6% of total consumption of petroleum and other liquid fuels. Increased U.S. crude oil production has replaced some crude oil imports, while increased refinery runs and global demand growth for petroleum products resulted in increased U.S. petroleum product exports. As a result, the United States remains a net importer of crude oil but less so, and is increasingly a net exporter of petroleum products. However, the extent to which regions of the country contribute to these changing trends varies.

U.S. net imports of total petroleum and other liquid fuels have declined by 7.5 million barrels per day (b/d) since 2005 to 5.1 million b/d in 2014. U.S. net imports of crude oil declined 3.1 million b/d between 2005 and 2014, with a further 0.2 million b/d decline for the first 9 months of 2015. The change in petroleum net imports other than crude has been even larger, with a 4.4 million b/d reduction in net imports between 2005 and 2014 (Figure 1).

twip151216fig1-lg

Crude oil supply patterns vary by region–some rely on imported crude oil, others mostly on domestic crude oil supply. Refineries on the East and Gulf Coasts (Petroleum Administration for Defense Districts (PADD) 1 and 3, respectively) have reduced their dependence on imported crude inputs in recent years. With very little crude oil produced in the region, refineries in PADD 1 historically imported close to 100% of the crude oil processed in the region. As crude-by-rail transport allowed increased shipments of domestic crude oil from other regions to reach East Coast refineries, imports as a percentage of refinery crude inputs fell to 60% in 2014. Data through September indicate continued declines in imports as a percentage of refinery runs to an average of 57% so far this year, but declining at a much slower rate than in 2013 and 2014 as the price difference between domestic crude oil and imported crude oil has narrowed. The Gulf Coast region is home to more than half of U.S. refining capacity, and produces the most crude oil. From 2005 to 2010, PADD 3 crude imports as a percentage of refinery crude inputs ranged from 80% to 72%. However, as domestic crude oil production increased, that percentage dropped to 41% in 2014, and has averaged 37% through September of this year.

In contrast, refineries in the Midwest (PADD 2) and the Rocky Mountains (PADD 4) have increased imports, almost entirely from Canada, as a percentage of in-region refinery crude inputs to 56% and 43%, respectively, in 2014. Data thus far in 2015 indicate that the Midwest crude imports as a percentage of refinery crude inputs may exceed the East Coast for the first time, with the Midwest averaging 58% versus the East Coast’s average of 57% (Figure 2).

twip151216fig2-lg

Turning from crude to products, increased domestic crude oil production leading to discounted domestic crude prices, coupled with global demand growth for petroleum products, has resulted in continued high U.S. refinery runs and increased U.S. petroleum product exports. U.S. petroleum product exports have increased for 13 consecutive years, with growth in recent years coming largely from distillate and gasoline exports, and more recently with the expansion of Hydrocarbon Gas Liquids (HGL) export capacity.

There is significant regional variation in petroleum product trade. Most petroleum product exports are from the Gulf Coast. Average PADD 3 total net petroleum product exports were 2.7 million b/d for the first nine months of 2015, in contrast to the same period of 2005 when PADD 3 was a net petroleum product importer of 280,000 b/d. Other regions have experienced far less of a dramatic shift in net import position. Average PADD 1 net imports in the first nine months of 2015 have fallen 913,000 b/d compared to the same period in 2005, helping the U.S. become a net product exporter. Data for the first nine months of 2015, which do not reflect the expected seasonal peak in gasoline exports during the final 3 months of the year, suggest that full-year 2015 U.S. net petroleum product exports will be higher than in 2014 (Figure 3).

twip151216fig3-lg

U.S. average gasoline and diesel fuel prices both decline

The U.S. average retail price for regular gasoline decreased two cents from the previous week to $2.04 per gallon as of December 14, 2015, 52 cents per gallon less than the same time last year. Prices decreased in all regions except the Midwest, where the price increased one cent to $1.90 per gallon. The East and Gulf Coast prices both fell three cents, to $2.04 per gallon and $1.79 per gallon, respectively. The Rocky Mountain and West Coast prices both decreased two cents, to $2.00 per gallon and $2.51 per gallon, respectively.

The U.S. average price of diesel fuel decreased four cents from last week to $2.34 per gallon, $1.08 per gallon lower than the same time last year. Prices declined in all regions of the nation, with both the Midwest and West Coast prices decreasing five cents, to $2.29 per gallon and $2.55 per gallon, respectively. The East Coast price was $2.37 per gallon and the Rocky Mountain price was $2.38 per gallon, both four cents lower than last week. The Gulf Coast price was $2.21 per gallon, two cents less than last week.

Propane inventories fall

U.S. propane stocks decreased by 1.7 million barrels last week to 99.0 million barrels as of December 11, 2015, 20.6 million barrels (26.3%) higher than a year ago. Midwest inventories decreased by 0.7 million barrels while Gulf Coast and East Coast inventories both decreased by 0.4 million barrels. Rocky Mountain/West Coast inventories decreased by 0.2 million barrels. Propylene non-fuel-use inventories represented 3.2% of total propane inventories.

Residential heating oil price decreases while propane price increases

As of December 14, 2015, residential heating oil prices averaged nearly $2.26 per gallon, almost 8 cents per gallon lower than last week and nearly an 89 cent decrease from one year ago. The average wholesale heating oil price this week is $1.17 per gallon, nearly 18 cents lower than last week and just below 99 cents per gallon lower than a year ago.

Residential propane prices averaged $1.98 per gallon, 1 cent per gallon higher than last week’s price and 40 cents lower than one year ago. Wholesale propane prices averaged 46 cents per gallon, almost 4 cents per gallon lower than last week and 21 cents lower than last year’s price for the same week.

For questions about This Week in Petroleum, contact the Petroleum Markets Team www.eia.gov